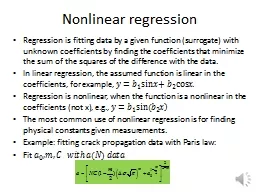
In linear regression the assumed function is linear in the coefficients for example Regression is nonlinear when the function is a nonlinear in the coefficients not x eg T he most common use of nonlinear regression is for finding physical constants given measurements ID: 725300
Download Presentation The PPT/PDF document "Nonlinear regression Regression is fitti..." is the property of its rightful owner. Permission is granted to download and print the materials on this web site for personal, non-commercial use only, and to display it on your personal computer provided you do not modify the materials and that you retain all copyright notices contained in the materials. By downloading content from our website, you accept the terms of this agreement.
Slide1
Nonlinear regression
Regression is fitting data by a given function (surrogate) with unknown coefficients by finding the coefficients that minimize the sum of the squares of the difference with the data.In linear regression, the assumed function is linear in the coefficients, for example, .Regression is nonlinear, when the function is a nonlinear in the coefficients (not x), e.g., The most common use of nonlinear regression is for finding physical constants given measurements.Example: fitting crack propagation data with Paris law:Fit
Slide2
Review of Linear Regression
Surrogate is linear combination of given shape functionsFor linear approximation Difference (residual) between data and surrogateMinimize square residualDifferentiate to obtain Slide3
Basic equations
General form Residuals Rms error Finding the coefficients requires the solution of an optimization problem.However, minimizing the sum of squares is a specialized problem with specialized algorithms. Matlab lsqnonlin is very good. Slide4
Example – Linear vs. Nonlinear Regression
y(1) = 20, y(2) = 7, y(3) = 5, and y(4) = 4.Data suggests a rational function Compare to quadratic polynomial Both use three coefficientsGet Slide5
Estimating uncertainty in coefficients
Brute force approach, generate noise in data and repeat multiple timesAlternatively linearize about optimum set of coefficients b*Now perform linear regression with .Provides improvement to solutionProvides estimate of uncertainty in , which is an estimate for the uncertainty in Slide6
Model based error for linear regressionThe common assumptions for linear regression
Surrogate is in functional form of true functionThe data is contaminated with normally distributed error with the same standard deviation at every point.The errors at different points are not correlated.Under these assumptions, the noise standard deviation (called standard error) is estimated as.Similarly, the standard error in the coefficients isSlide7
Rational function example
Linearize with respect to b’sPerform fit by linear regression =1.0e-007* [0.1435 0.3685 0.1230]’Finally perform error analysisStandard errors range between 4% to 10% of the b’s (1.99 -6.99 0.612) Slide8
Application to crack propagation
Paris law and its solution Coppe, A. ,Haftka, R.T., and Kim, N.H. (2011) " Uncertainty Identification of Damage Growth Parameters Using Nonlinear Regression" AIAA Journal ,Vol 49(12), 2818–2621 Properties to be identified from measurements Slide9
Example with only m unknown
Simulation with b=0 v=[-1,1]mm, m=3.8Excellent agreement between Monte Carlo (1,000 repetitions) simulation and linearization.Slide10
All three unknownDifficult to differentiate between initial crack size and biasSlide11
Problems
Using the data for the rational function, repeat the fit and the uncertainty calculation for an exponential decay model Instead of using the data in Slide 4, generate your own data for 31 uniformly distributed points (1,1.3,…)from the identified algebraic model and contaminate the data with normally distributed random noise with zero mean and standard deviation of 1. Compare the standard error from linear regression with the value you get by repeating the process multiple times using different realizations of the noise.