PPT-12 Carbohydrate metabolism
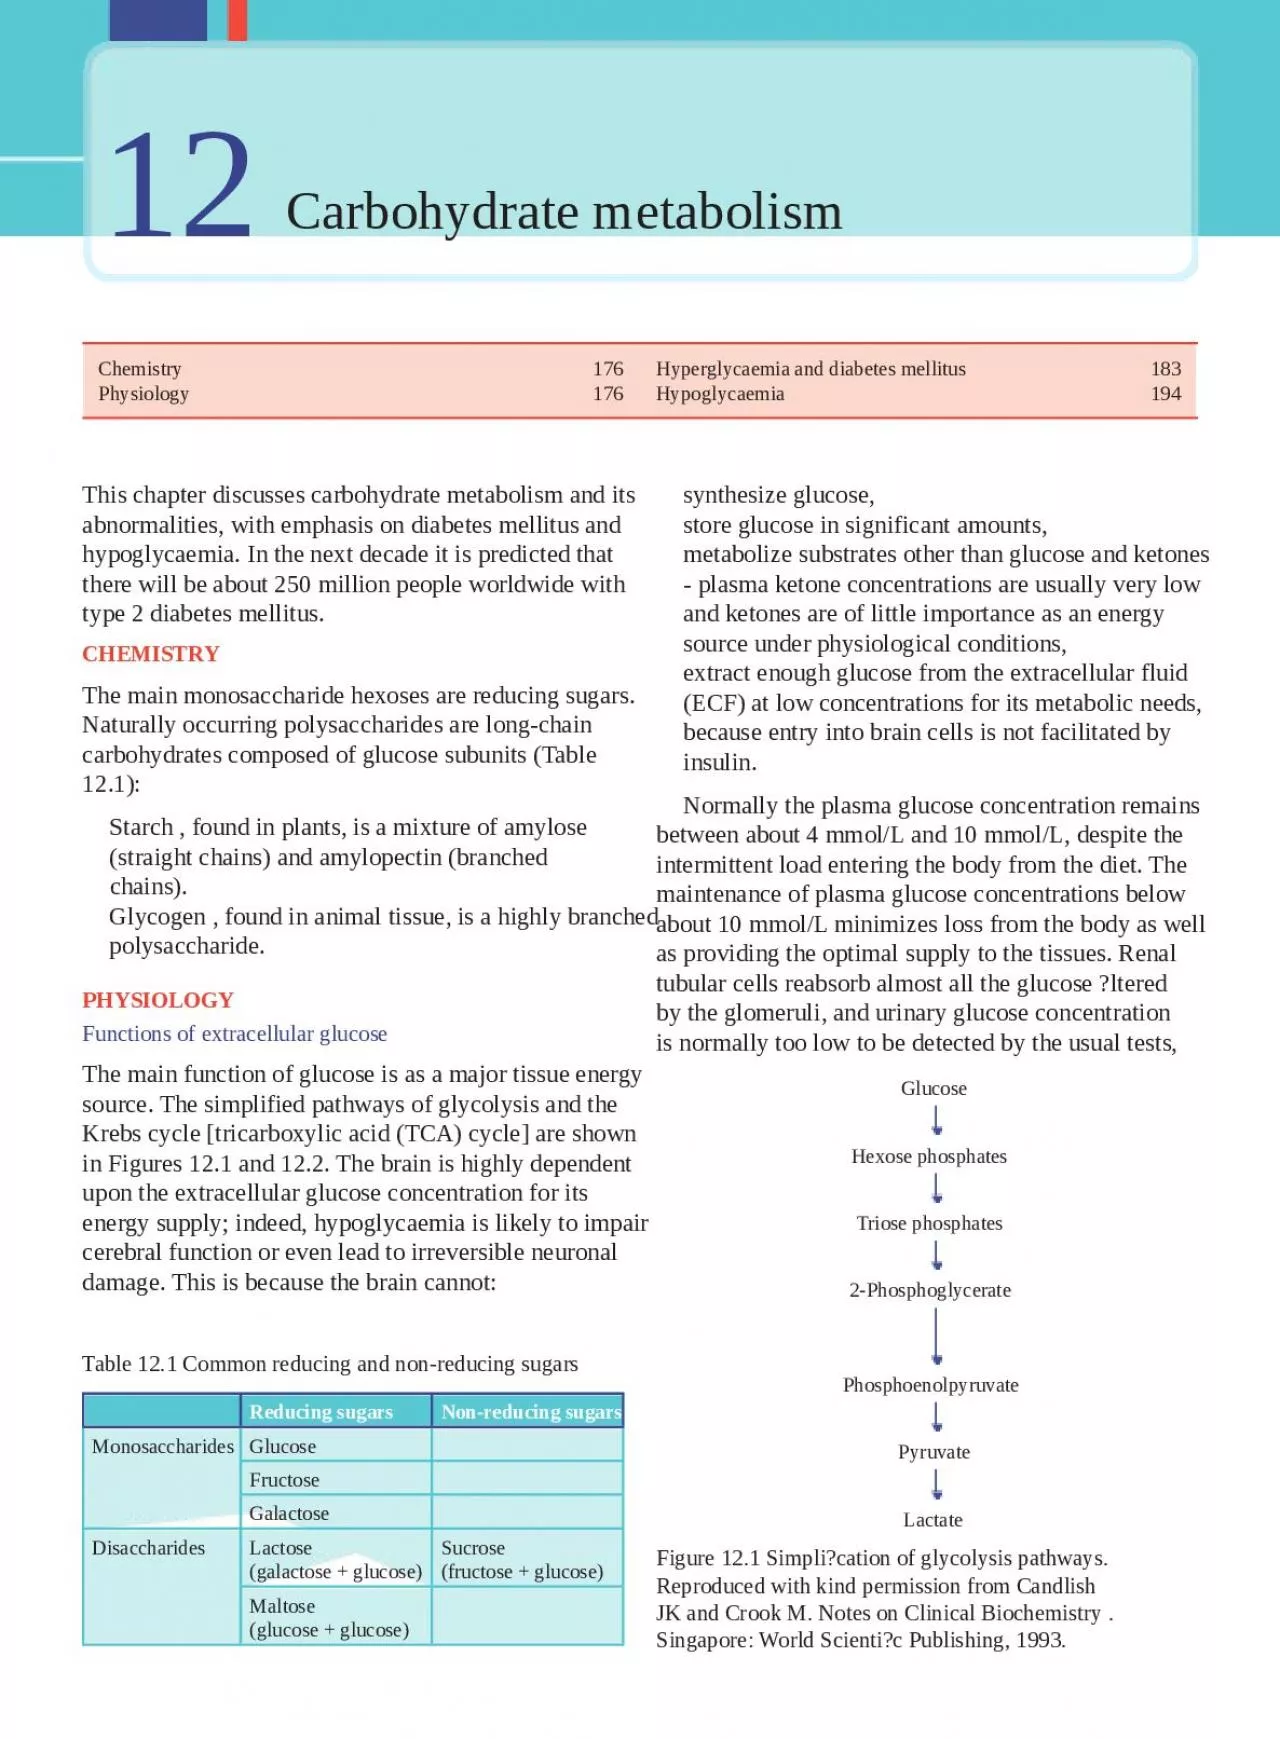
Chemistry 176 Hyperglycaemia and diabetes mellitus 183 Physiology 176 Hypoglycaemia 194 This chapter discusses carbohydrate metabolism and its synthesize glucose
Download Presentation
"12 Carbohydrate metabolism" is the property of its rightful owner. Permission is granted to download and print materials on this website for personal, non-commercial use only, provided you retain all copyright notices. By downloading content from our website, you accept the terms of this agreement.
Presentation Transcript
Transcript not available.