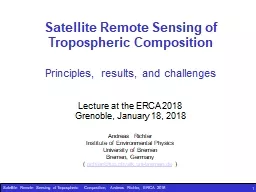
Principles results and challenges Lecture at the ERCA 2018 Grenoble January 18 2018 Andreas Richter Institute of Environmental Physics University of Bremen Bremen Germany richteriupphysikunibremende ID: 777788
Download The PPT/PDF document "1 Satellite Remote Sensing of Tropospher..." is the property of its rightful owner. Permission is granted to download and print the materials on this web site for personal, non-commercial use only, and to display it on your personal computer provided you do not modify the materials and that you retain all copyright notices contained in the materials. By downloading content from our website, you accept the terms of this agreement.
Slide1
1
Satellite Remote Sensing of Tropospheric Composition
Principles, results, and challenges
Lecture at the ERCA
2018
Grenoble,
January 18, 2018
Andreas Richter
Institute of Environmental Physics
University of Bremen
Bremen, Germany
(
richter@iup.physik.uni-bremen.de
)
Slide22
Overview
What is Remote Sensing?
How can the troposphere be probed by remote sensing?
What is the sensitivity of remote sensing measurements?A few examples for tropospheric satellite observationsWhat is the future of satellite remote sensing?
https://
media.quizizz.com/resource/gs/quizizz-media/questions
Slide3Who am I?Leading UV/vis remote sensing group at Institute of Environmental Physics, University of Bremen, head: Prof. John Burrows.Working on all aspects of UV/vis remote sensingInstruments (ground, airborne, satellite)Radiative transferRetrieval algorithmsData interpretationSome atmospheric topics I‘m interested inNOx emissions, distributionsand chemistryEmission changes / trendsHalogen chemistry inpolar regions3
www.doas-bremen.de
Slide4The Eye as a Remote Sensing Instrumenteye: remote sensing instrument in the visible wavelength region (350 - 750 nm)
signal processing in the eye and in the brain
colour (RGB) and relative intensity are used to identify surface types
large data base and neuronal network used to derive object properties
4
Slide5The Eye as a Remote Sensing Instrument
eyes are scanning the environment with up to 60 frames per second
170° field of view, 30° focus
5
Slide6The Eye as a Remote Sensing Instrument
!!!
stereographic view, image processing, and a large data base enables detection of size, distance, and movement
6
Slide7The Eye as a Remote Sensing Instrument
?
the human eye is a passive remote sensing instrument, relying on (sun) light scattered from the object
no sensitivity to thermal emission of objects unlike in some other animals
8-14 microns image of a cat
7
Slide8The Eye as a Remote Sensing Instrument
We can also apply active remote sensing by using artificial light sources
!!!
8
Slide9Schematic of Remote Sensing Observations
Validation
Sensor
Measurement
Object
Changed Radiation
Radiation
Data Analysis
Final Result
A priori information
Forward Model
9
What
we
see
What
we
already
know
What
we
should
see
Slide10The Electromagnetic Spectrumnearly all energy on Earth is supplied by the sun through radiationwavelengths from many meters (radio waves) to nm (X-ray) short wavelength = high energyradiation interacts with atmosphere and surfaceabsorption (heating, shielding)excitation (energy input, chemical reactions)re-emission (energy balance)
10
Slide11Wavelength Ranges in Remote SensingUV: some absorptions + profile information aerosols vis: surface information (vegetation) some absorptions aerosol information IR: temperature information cloud information water / ice distinction many absorptions / emissions + profile information
MW:
no problems with clouds
ice / water contrast
surfaces some emissions + profile information
11
Slide12Atmosphere
Absorption on the ground
Scattering / Reflection on the ground
Emission from
the ground
Scattering from a cloud
Transmission through a cloud
Scattering / reflection on a cloud
Scattering within a cloud
Cloud
Emission from
a cloud
Absorption
Scattering
Aerosol / Molecules
Emission
Radiative
Transfer in the
Atmosphere
passive sensor, UV / visible / IR
12
Slide13Typical light paths: UVDark surfaceStrong Rayleigh scatteringMost photons are scattered above absorption layer=> Low sensitivity to BL signals!
13
sensitivity
altitude
Slide14Typical light paths: visibleBrighter surfaceSignificant Rayleigh ScatteringMany photons are scattered above absorption layer=> Reduced sensitivity to BL signals!
14
sensitivity
altitude
Slide15Bright surface (snow, ice): UV and visibleSurface reflection dominatesMultiple scattering in surface layer=> Enhanced sensitivity to BL signals!
15
sensitivity
altitude
Slide16Typical light paths: NIRBright surface (except for oceans)Negligible ScatteringVery good sensitivity to BL signals …But only over land
16
sensitivity
altitude
Slide17Typical light paths: thermal IRRadiation is emitted from different altitudesSensitivity to surface layer depends on thermal contrast=> Usually low sensitivity to BL signals!
17
sensitivity
altitude
Slide18Thermal IR with high thermal contrast (deserts)Radiation is emitted from different altitudes and from the surfaceIf surface is hotter than lower atmospheric layer, good sensitivity to BL signals!
18
sensitivity
altitude
Slide19Example: Thermal Contrast IASIThermal contrast (temperature difference between surface and first atmospheric layer) is highest in the morning over barren landVertical sensitivity varies in space and time
19
Day Night
Clerbaux, C., et al., Atmos. Chem. Phys., 9, 6041–6054, 2009
Slide20Vertical sensitivity of satellite measurementsThe sensitivity of the satellite measurements depends on the altitude of the absorbing layerThis is often expressed in the form of weighting functions which give the sensitivity of the signal as function of altitude of the trace gas layerAs the vertical distribution can usually not be (completely) determined from the measurements, a priori information is needed in the retrievalThe dependence of the retrieved quantity on the real atmospheric profile depends on both, the sensitivity of the measurements and the assumptions made in the a prioriThis is often expressed as averaging kernels which describe the sensitivity of the retrieved quantity on the amounts of trace gas in the different altitudes in the atmosphereComparison of satellite retrievals with other measurements are only meaningful if the averaging kernels are accounted for
20
Slide21Vertical sensitivity of satellite measurementsIn the retrieval process, the vertical sensitivity is accounted for For IR measurements, it can be well estimated from the temperature measurements For UV/vis measurements, aerosols and surface reflectance are often a problemWhere there is no sensitivity, the a priori will be retrieved
21
sensitivity
altitude
concentration
altitude
Estimated sensitivity
A priori
r
etrieved
profile
real
profile
Slide22Example: Averaging Kernels for airborne NO2 measurementsAircraft flying successively at different altitudes (“missed approach”)Very large sensitivity at flight altitudeSharp and well separated averaging kernels Large number of degrees of freedom (DOFS) Good profile retrieval
22
Baidar
et al., Atm. Meas. Tech., 2013
Slide23Example: Averaging Kernels for satellite CODepending on spectral resolution and wavelength, the number of degrees of freedom (DOFS) varies, as well as the shape of the averaging kernels
23
George et al., Atmos. Chem. Phys., 9, 8317–8330, 2009
Slide24How do we get vertical resolution in nadir IR observations?Thermal infrared measurements have intrinsic altitude information fromPressure broadeningTemperature dependence of line strengthsPressure shiftThe amount of vertical information depends onSpectral resolution of the measurementSignal to noise ratioThe moleculeThermal contrast
24
Low p
High p
wavenumber
intensity
Slide25How do we get vertical resolution in nadir UV/vis observations?
25
Basic problem:
Nadir measurements contain stratospheric and tropospheric absorptions and in many cases no intrinsic vertical information
Assimilated Stratosphere
Slide26Clouds in UV/vis : Shielding Effectthe part of an absorber profile situated below a cloud is basically “hidden” from view for the satelliteonly through thin clouds over reflecting surfaces, sensitivity towards the lower part of the profile is still relevantthe shielding effect is larger than expected from the geometrical size of the cloud because of its brightness
albedo =
0.05
albedo = 0.75
Rayleigh scattering
50% cloud cover but only
6,25%
surface contribution!
26
Slide27Clouds in UV/vis : Albedo Effectthe part of an absorber above a cloud is better visible from space as the ratio of photons that go through it increases through the albedo effect
albedo =
0.05
Rayleigh scattering
some photons are scattered before reaching the absorber
most photons are absorbed on the ground
27
Slide28Clouds in UV/vis : Albedo Effectthe part of an absorber above a cloud is better visible from space as the ratio of photons that go through it increases through the albedo effect
albedo =
0.05
albedo = 0.75
Rayleigh scattering
many photons are scattered below the absorber
28
sensitivity
altitude
cloud
Slide29Satellite Orbits(Near) Polar Orbit:orbits cross close to the poleglobal measurements are possiblelow earth orbit LEO (several 100 km)ascending and descending branchspecial case: sun-synchronous orbit:overpass over given latitude always at the same local time, providing similar illuminationfor sun-synchronous orbits: day and night branchesGeostationary Orbit:satellite has fixed position relative to the Earthparallel measurements in a limited area from low to middle latitudes36 000 km flight altitude, equatorial orbit
http://www2.jpl.nasa.gov/basics/bsf5-1.htm
http://www.ccrs.nrcan.gc.ca/ccrs/learn/tutorials/fundam/chapter2/chapter2_2_e.html
29
Slide30Effect of Spatial Resolution: Example NO2
30
For species with short atmospheric life time, horizontal variability is large
Spatial resolution of sensor is relevant for interpretation
Spatial resolution also influences cloud fraction
Time of overpass may also play a role!
OMI: 13:30 LT
Slide31Why do we need satellite measurements?not all measurement locations are accessible (atmosphere, ice, ocean)remote sensing facilitates analysis of long time series and extended measurement areasfor many phenomena, global measurements are neededremote sensing measurements usually can be automatedoften, several parameters can be measured at the same timeon a per measurement basis, remote sensing measurements usually are less expensive than in-situ measurements
31
Slide32What is problematic about satellite measurements?remote sensing measurements are always indirect measurementsthe electromagnetic signal is often affected by more things than just the quantity to be measuredusually, additional assumptions and models are needed for the interpretation of the measurementsusually, the measurement area / volume is relatively largevalidation of remote sensing measurements is a major task and often not possible in a strict senseestimation of the errors of a remote sensing measurement often is difficult
32
Slide33Comparison of different observation options33Nadir:view to the surface
good spatial resolution
little vertical resolution
Limb:
good vertical resolution,
but only in the UT/LS regionlarge cloud probability
UV/
vis
/NIR:
sensitivity down to surface
relevant species observable
limited number of species
daytime only
no intrinsic vertical resolution in nadir
aerosols introduce uncertainties in light path
IR:
large number of potential species
day and night measurements
some vertical resolution in nadir
weighted towards middle troposphere
problems with strong absorbers
problems with dark (solar IR) or
cold (thermal IR) surfaces
Slide34MOPITTInstrument: IR gas correlation spectrometer with pressure modulationOperational since March 2000Spatial resolution: 22 x 22 km2Day + night measurementsGlobal coverage: 3.5 daysSpecies: CO (1 – 2 DOFS)
34
Slide35MOPITT: CO column
35
http://www.acd.ucar.edu/mopitt/
MOPITT CO column January 2009
CO total column [101
8
moelc cm
-2
]
Hemispheric gradient
Topography
Pollution in Asia
Biomass burning in Africa
Slide36TOMSInstrument: UV discrete (6) wavelengths grating spectrometerOperational: October 1978 - 2004Spatial resolution: 50 x 50 km2Global coverage: 1.5 daysSpecies: O3, SO2
36
Slide37TOMS: Ozone columns Large scale tropospheric ozone patterns retrieved using the cloud slicing methodDuring El Nino year, clear ozone maximum over IndonesiaOrigins: photochemical smog from biomass burning and change in circulation pattern
37
Ziemke, J. R et al., (2001), “Cloud slicing”: A new technique to derive upper tropospheric ozone from satellite measurements,
J. Geophys. Res.
, 106(D9), 9853–9867
Slide38GOME / GOME-2Instrument: 4 channelUV/vis grating spectrometerOperational on ERS-2 7.1995 – 6.2003 - 2011Spatial resolution 320 x 40 km2Global coverage: 3 daysSpecies: O3, NO2, HCHO, CHOCHO, BrO, IO, SO2, H2O
38
GOME-2 A
on
MetOp
A since
1.2007
80 x 40
km
2
1.5
days
GOME-2 B
on
MetOp
B since 1.2013
80 x 40 km
2
1.5 days
40
x 40
km
2
3
days
Slide39GOME: Polar springtime BrOLarge regions of enhanced boundary layer BrO in polar springAutocatalytic release of Br from sea salt from aerosols / frost flowers / ice surfacesRapid ozone destruction and link to Hg chemistry
39
Richter, A. et al., GOME observations of tropospheric BrO in Northern Hemispheric spring and summer 1997,
Geophys. Res. Lett
., No.
25
, pp. 2683-2686, 1998.
Slide40SCIAMACHYInstrument: 8 channel UV/vis/NIR grating spectrometernadir, limb + occultation measurementsOperational on ENVISAT 8.2003 – 4.2012Spatial resolution (30) 60 x 30 km2Global coverage: 6 daysSpecies: O3, NO2, HCHO, CHOCHO, BrO, IO, SO2, H2O, CH4, CO2, CO
40
scanner modules
telescope
pre-disperser
UV channels 1-2
Vis channels 3-4
NIR channels 5-6
SWIR channels 7-8
www.sciamachy.de
Slide41SCIAMACHY: Methane: The missing tropical source
SCIAMACHY
TM3 (model)
SCIAMACHY – TM3
SCIAMACHY measurements and atmospheric models agree well over most of the globe
In the tropics, the model underestimates SCIAMACHY measurements
This indicates a tropical CH
4
source missing in current models
Important to assess impact of anthropogenic activities
Effect is smaller using current satellite data version but still there
Frankenberg et al., science, 308. no. 5724, pp. 1010 - 1014
DOI: 10.1126/science.1106644, 2005
41
Slide42Buchwitz et al., ACP, 2007; Schneising et al., ACP, 2008Buchwitz et al., personal communication, 2014SCIAMACHY: CO
2
in the Northern Hemisphere
42
Detection of annual cycle
Detection of year-to-year increase
Detection of spatial variability
Not yet accurate enough for Kyoto monitoring on country level
SCIAMACHY and GOSAT: CO
2
Slide43OMIInstrument: UV/vis imaging grating spectrometer (push-broom)Operational on Aura since October 2004Spatial resolution: up to 13 x 24 km2Global coverage: 1 daySpecies: O3, NO2, HCHO, CHOCHO, BrO, SO2
43
www.
knmi
.nl/
omi
/
Slide44OMI: SO2 columnsSO2 signals from volcanoes in Ecuador and Columbia Clear signature of Peruvian copper smeltersVery large sources of local pollutionEffect of (temporary) shut down and (permanent) implementation of emission reductions (H2SO4 production) can be monitored
44
Carn, S. A., et al., t (2007), Sulfur dioxide emissions from Peruvian copper smelters detected by the Ozone Monitoring Instrument, Geophys. Res. Lett., 34, L09801, doi:10.1029/2006GL029020.
9.2004 – 6.2005
Slide45TROPOMI on Sentinel 5-PInstrument: UV/vis/SWIR imaging grating spectrometer (push-broom)Launched October 2017, operational from July 2018Spatial resolution: up to 3.5 x 7 km2Global coverage: 1 daySpecies: O3, NO2, HCHO, CHOCHO, BrO, SO2, H2O, CO, CH4, CO2
45
www.
tropomi.eu
Slide46S5P: NO2 columnsPreliminary test data from December 2018, IUP Bremen analysis, not quantitative, no cloud screening, no error flagging, no QAVery large improvement in spatial detail, separation of cities and power plants, atmospheric transport, … 46
Preliminary
!
Slide47IASIInstrument: IR Fourier Transform Spectrometer, 0.5 cm-1Operational on MetOp-A since Jan. 2007, on MetOp-B since 1.2013Spatial resolution: circular, 12 km diameterGlobal coverage 2x per day (day and night)Species: H2O, HDO, CH4, O3, CO, HNO3, NH3, CH3OH, HCOOH, C2H4, SO2, CO2, N
2
O, CFC-11, CFC-12, HCF-22, OCS, ...
47
Clerbaux, C., et al., Atmos. Chem. Phys., 9, 6041–6054, 2009
Slide48IASI: NH3First global measurement of AmmoniaAmmonia hot-spots where intense agriculture / livestock leads to high emissionsRelevant for particulate formation and acidification / eutrophication
48
Clarisse et al., nature geoscience, doi:10.1038/ngeo551, 2009
Slide49Summary and ConclusionsSatellite observations of tropospheric composition in the UV/vis, NIR and thermal IR provide consistent global datasets for many species including major air pollutants such as O3, CO, NO2, and HCHOThe measurements are averaged horizontally and vertically which makes them difficult to compare to point measurementsRemote sensing in an indirect method that necessitates use of a priori information in the data retrieval which has an impact on the resultsVisible and NIR measurements provide good sensitivity to the boundary layer, the thermal IR has intrinsic vertical informationIn spite of the relative large uncertainties involved in satellite remote sensing, they provide a unique source of information on the composition of the troposphere
49
Slide50What is the future of satellite measurements of tropospheric trace gases?Satellite measurements will be improved byBetter spatial resolution (Sentinel 5P, Sentinel 5, CARBONSAT)Better temporal resolution (geostationary observations Sentinel 4)Better coverage of species and vertical resolution (extension of the wavelengths covered (from UV to IR)Better precision (higher spectral resolution in the IR)High vertical resolution (active systems)The usefulness of satellite data will be improved by better integration with other measurementsSatellite data will be strongly integrated in atmospheric models
50
Slide51Active measurements: CALIOP aerosol
51
http://www-calipso.larc.nasa.gov/
Slide52Thank you for your attention
and
questions
please!
http://www.animationlibrary.com/animation/25494/Alarm_jumps/
52
www.doas-bremen.de