/
Geometry information from Geometry information from

Geometry information from - PowerPoint Presentation

cheryl-pisano
cheryl-pisano . @cheryl-pisano
Follow
342 views
Uploaded On 2019-11-08

Geometry information from - PPT Presentation

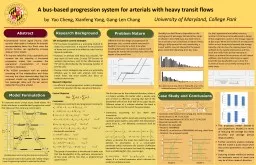
Geometry information from Liufang Ave North in Beijing Green phase s 9977667560 Dwell time distribution N 309 N 277 N 246 Maximal bandwidth 50s Models to be evaluated Model1 MAXBAND ID: 764497

model bus dwell time bus model time dwell transit band stops progression control green tsp intersections arterials heavy delay

Share:

Link:

Embed:

Download Presentation from below link

Download Presentation The PPT/PDF document "Geometry information from" is the property of its rightful owner. Permission is granted to download and print the materials on this web site for personal, non-commercial use only, and to display it on your personal computer provided you do not modify the materials and that you retain all copyright notices contained in the materials. By downloading content from our website, you accept the terms of this agreement.


Presentation Transcript

Geometry information from Liufang Ave. North in BeijingGreen phase (s): 99,77,66,75,60Dwell time distribution: N (30,9), N (27,7), N (24,6)Maximal bandwidth: 50sModels to be evaluatedModel-1: MAXBANDModel-2: an extension of MAXBAND with avg. dwell timeModel-3: the proposed model A bus-based progression system for arterials with heavy transit flows by Yao Cheng, Xianfeng Yang, Gang-Len Chang University of Maryland, College Park Abstract Conventional Transit Signal Priority (TSP) controls often reach a limitation for arterials accommodating heavy bus flows since the priority function can significantly increase delay at minor streets.To improve reliability of bus operations and increase the bus ridership, a bus-based progression model that considers the operational characteristics of transit vehicles is developed.The VISSIM simulation with an arterial consisting of five intersections and three two-way bus stops demonstrates that the proposed model can significantly reduce bus passenger delay and the per person delays for the entire arterial. Research Background TSP and passive control strategiesTSP has been recognized as a promising method to reduce bus travel time. It responds to the presence of buses and is proven to be effective under low bus demand conditions.However, at arterials with heavy bus volumes, TSP may reach its limit since 1) most TSP focuses on isolated intersections, and 2) the effectiveness of TSP will be diminished by the increasing number of priority calls.Passive control strategies may serve as a potentially effective way to deal with arterials with heavy transit flows. But most studies also focus on isolated intersections.Research ObjectiveAn efficient transit progression model is developed, which fully considers the bus operational features. The proposed model (Model-3) can outperform Model-2 in terms of reducing the average bus delay (15.25%) and average person delay (14.00%). Further sensitivity analysis indicates that the model is quite robust when two control parameters vary within a range.Exploring a better method to analyze the stochastic nature of dwell time may be a future research direction. Problem Nature Different from the design of progression for passenger cars, a transit vehicle may need to dwell at a bus stop for a short time when travelling between intersections. A green band designed for transit vehicles shall fully reflect the impact of bus dwell time. Model Formulation To overcome these critical issues listed above, this study introduces a variable-band progression model that takes each bus stop as a control point. Control ObjectiveConstraintsInterference constraints and progression constraintsBandwidth constraintsThis group of constraints is introduced to make sure that the bandwidths at the upstream intersections of bus stops will be less than a predetermined upper bound. Case Study and Conclusions Variable green bands using bus stops as control point Notably, bus dwell time is dependent on the varying level of passenger demand at bus stops. As shown in most field data, bus dwell time is not a constant, but is stochastic in nature. Hence, failing to fully account for such uncertainty, a transit vehicle may not stay within the preset green band after departing from bus stops. For both operational and safety concerns, another critical issue to be addressed in design of bus progression system is the storage capacity at bus stops. When the number of arriving buses within a short time period exceeds the storage capacity of a bus stop, the queuing buses may spillback to the nearby intersection and thus block the traffic flows at that intersection. Hence, to prevent the occurrence of such queue spillback, one shall pre-determine an upper bound for bus bandwidth so as to limit the number of buses concurrently arriving at the same stops. Bus dwell time at stop-3 & 4 of Jiefang Rd, Jinan China collected between 11/01/2012 and 11/07/2012 The proposed model is formulated with a Mixed-Integer-Linear Programming method to optimize the offsets. The first two are for the outbound direction, where x i is a binary variable. No matter what x i equals, only one of them is effective, ensuring that half of the bandwidth will be less than half of its upper bound. Different values of x i indicate whether the band is close to the start or the end of the green phase. Constraints accounting for bus dwell time uncertainty T o keep vehicles (within band αb i ) entering from the upstream green band to stay within the downstream green band b i+1, the following constraints shall be satisfied:where, μ denotes the mean bus dwell time and ε denotes its uncertainty; α is a conservative parameter which represents the portion of effective bandwidth for the upstream bus band. By integrating them and defining βσ=|2ε|, one can get: where, β is a control parameter which indicates the preferred confidence level. Model-2 Model-3