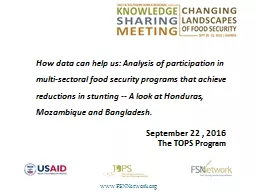
in multisectoral food security programs that achieve reductions in stunting A look at Honduras Mozambique and Bangladesh September 22 2016 The TOPS Program 1 CARE Honduras Food Security Program ID: 561845
Download Presentation The PPT/PDF document "How data can help us: Analysis of partic..." is the property of its rightful owner. Permission is granted to download and print the materials on this web site for personal, non-commercial use only, and to display it on your personal computer provided you do not modify the materials and that you retain all copyright notices contained in the materials. By downloading content from our website, you accept the terms of this agreement.
Slide1
How data can help us: Analysis of participation inmulti-sectoral food security programs that achieve reductions in stunting -- A look at Honduras, Mozambique and Bangladesh.
September 22 , 2016The TOPS Program
1Slide2
CARE Honduras Food Security ProgramFY1996 to FY2000
Statistically significant reduction in stunting: BL 54.9
% FE 47.2% Control FE 65.8% Slide3
3CARE Honduras Food Security Program FY1996 to FY2000HOGASA: Maternal-child health, nutrition and WASH with preventive ration to <2 and PLWEXTENSA: Increased agriculture production and diversified production
PODER: Food for AssetsSlide4
VariableCoefficient
Participation in any 1 intervention (reference)
1.0000
Participation in 2 interventions
1.1115
Participation in all 3 interventions
0.3441
*
4
Effect of household participation in interventions of
the CARE Food Security Program on child stunting, age 24-59 months
* Regression analysis with controls for SES; significant at 0.01Slide5
CARE Mozambique Viable Initiatives for the Development of Agriculture (VIDA)FY1997 to FY20015NAMPULA PROVINCE
Started as agriculture production / agribusiness program
At midterm found statistically significant increases in household income but no reduction in stuntingAdded nutrition education component through women’s groups, with some linkages with farmer groupsSlide6
6Slide7
Results: No reduction in stunting? Z score
Height-for-ageBaseline 1997
Survey 2002
n
%
n
%
Mild or none (
>
-2
sd)352
40.0
34141.07Slide8
Results: Trend in reduction of severity of stunting Z score
Height-for-ageBaseline 1997
Survey 2002
n
%
n
%
Severe (<-3 sd)
304
34.5
210
25.3
Moderate (<-2 sd and >-3 sd)
224
25.5
282
33.9
Mild or none (
>
-2 sd)
352
40.0
341
41.0
TOTAL
880
100.0831100.0
8
Importance of stratifying results!!Slide9
Cross-tabulation of chronic malnutrition with participation9Household participation in VIDA Project activities
Height-for-Age< -2 s.d.N
%Any project activity
181
56.9
No participation
225
64.1
Agriculture only
77
49.3Nutrition only8662.7Agriculture and nutrition
18*72.0
No participation22564.1* Further investigation showed that fully integrated activities as planned were not prioritized – instead referrals from nutrition groups to agriculture support were made for children in malnourished condition -- a “curative” focus vs. prevention intention. Strategies were reviewed and preventive focus strengthened. Slide10
CARE Bangladesh SHOUHARDO-I FY1998 to FY201010In 18 districts, including
peri-urban and rural communities in North Char, Mid Char, Haor and Coastal areas.Reduction in stunting: BL 51.9% FE 36.4%Slide11
Participation at the household level11Program Group Activities
% of household participationCore Occupational Group (ag/IGA)72.2%Mothers’ Group94.8%
Additional analysis (regression)
IMPORTANCE OF INTEGRATION AT THE HOUSEHOLD LEVEL
!
p-value
NUMBER OF
INTERVENTIONS
households participated in over the previous year and
CHILD
STUNTING0.013 **Slide12
Core Occupational Group interventionsCOG Intervention% of household participationAgriculture
22.5CHD: Vegetable production30.9CHD: Fruit production8.2
CHD: Livestock20.2IGA: Non agriculture
12.9
IGA: Agriculture
11.0
IGA: Livestock
10.6
Fisheries
9.1
ANY COG INTERVENTION72.212Slide13
WALA Project: FY2009-FY2014Reduction in stunting: BL 42.4% FE 37.1%*Statistically significant at p<0.0113Slide14
Nutrition / WASH / Agro-economicsBLFEMinimum adequate diet12.3%20.0% *Improved hygiene
(latrine, handwashing, bed nets)6.1%26.0% *Average Household Dietary Diversity Score4.29
4.50 *14
Positive Results in IPTT Indicators
in Multiple Sectors
*Statistically significant at p<0.01Slide15
Percentage of Households Participating in X Number of WALA Project ActivitiesNUMBER OF WALAPROJECT ACTIVITIES% HH at FE0 ACTIVITIES13.2
1 to 3 ACTIVITIES37.44 to 6 ACTIVITIES29.57+
ACTIVITIES19.9
15Slide16
The TOPS Program was made possible by the generous support of the American people through the United States Agency for International Development (USAID) Office of Food for Peace. The contents of this presentation do not necessarily reflect the views of USAID or the United States Government.