/
In spite of these efforts, there has been little systematic analysis o In spite of these efforts, there has been little systematic analysis o

In spite of these efforts, there has been little systematic analysis o - PDF document

cheryl-pisano
cheryl-pisano . @cheryl-pisano
Follow
400 views
Uploaded On 2016-05-12

In spite of these efforts, there has been little systematic analysis o - PPT Presentation

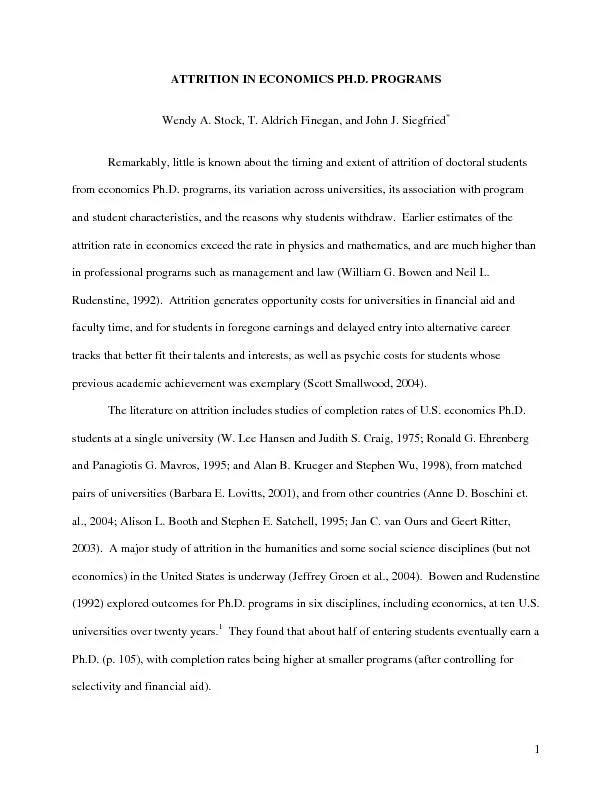
I Data Sources and Variables In 200304 we collected baseline programlevel attrition information from department representatives 2 at 27 US economics PhD programs including 15 of the 22 lar ID: 316040

Data Sources and

Share:

Link:

Embed:

Download Presentation from below link

Download Pdf The PPT/PDF document "In spite of these efforts, there has bee..." is the property of its rightful owner. Permission is granted to download and print the materials on this web site for personal, non-commercial use only, and to display it on your personal computer provided you do not modify the materials and that you retain all copyright notices contained in the materials. By downloading content from our website, you accept the terms of this agreement.


Presentation Transcript

In spite of these efforts, there has been little systematic analysis of attrition across the spectrum of U.S. economics Ph.D. programs. Accordingly, we have followed 586 individuals who entered one of 27 economics Ph.D. programs in Fall 2002 in order to estimate dropout rates, discover student and program characteristics related to attrition, and reasons for withdrawals. I. Data Sources and Variables In 2003-04, we collected baseline program-level attrition information from department representatives 2 at 27 U.S. economics Ph.D. programs, including 15 of the 22 largest, and 12 others, each averaging at least 5 Ph.D.s per year. 3 The programs are diverse in terms of 1993 National Research Council (NRC) ratings (Marvin Goldberger et al., 1995). Three are Tier 1, six Tier 2, seven Tier 3, six Tier 4, and four Tier 5. One is unranked. 4 Together the 27 produced 42 percent of the Ph.D.s issued by U.S. programs awarding at least one degree from 1998 to 2001. 5 They probably accounted for a smaller proportion of dropouts, however. Higher-ranked programs are over-represented: 22 of the 27 are among the top rated 48 programs. Because these programs recruit more qualified students, help them finish faster, and place them in better jobs, our data may understate attrition for the entire population of economics Ph.D. producing programs. Program information includes the number of graduate faculty, 1993 NRC ranking, the size of the first-year class, the faculty-student ratio, and indicators of university control (private or public), whether a terminal master's degree is offered, and whether first-year students must pass some written exams before starting their second year. Following Chris M. Golde (2000) and Lovitt (2001), who argue that much Ph.D. student attrition arises from the failure of programs to integrate students academically and socially into graduate study, we also collected measures of three possible indications of integration—whether first-year students must attend 2 IV. Predicting Attrition Probit estimates of the dropout decision as a function of program (P) and student-level (S) characteristics are reported in Table 3, where Pr (dropout t = 1) = ( 0 + 1 P+ 2 S), and is the standard normal cumulative density function. We estimate first-, second-, and two-year attrition. From 10 to 15 percent of the variation in student attrition can be explained by program-level and ex-ante application information alone. Students at Tier 1 or 2 and Tier 5 Ph.D. programs experienced lower two-year attrition than those at Tiers 3 or 4 programs, ranked 16 through 48 (the omitted category). Neither the presence of a terminal master's program nor the control of university attended is associated with attrition. Second-year attrition is higher where there is an exam requirement (at the marginal 0.104 level), as would be expected if exams winnow out students with low completion prospects. Consistent with the predictions of Golde (2000) and Lovitts (2001) about early integration of students into a graduate student culture, attrition is markedly lower at programs that assign shared offices to students on financial aid. 11 Our other integration measures, seminar attendance and individual faculty advisers, are unrelated to dropping out. Unlike earlier findings that women drop out more often than men, that Americans withdraw more frequently than foreign students (Smallwood, 2004), and that personal characteristics matter more for attrition than for time-to-degree (Ehrenberg and Mavros, 1995), we find that no demographic measure is significantly related to attrition; nor does a prior graduate degree, an undergraduate degree in economics or math, or a dual major in both seem to matter. 12 Raw attrition rates were negatively related to all three GRE scores, but the relationship for the analytical score disappears in the probit estimates. 13 Higher verbal and quantitative GRE 6 scores are related to lower attrition once other factors are controlled. Although one might expect less first- and second-year attrition among students with an interest in micro theory, macro theory, or econometrics (the core of the first-year curriculum), that does not appear to be the case. Raw attrition was lower for students who were awarded fellowship aid, and higher for students who received no financial aid in their first year of Ph.D. study. Our probit estimates, however, reveal that once other factors are controlled, only research assistant status relates to attrition, reducing it, as is found commonly in research on Ph.D. attrition (Smallwood, 2004). 14 Because dropout behavior may differ by demographic characteristics, we estimated two-year attrition separately by sex and citizenship (results are available from the authors). The sex-specific runs show that the negative relation between shared office availability and attrition is driven by the behavior of women. Dropouts decline as the GRE analytical score rises for men, but not for women. In contrast, dropouts decline as the GRE quantitative score rises for women, but not for men. American women are more likely to drop out than female international students, but there is no corresponding difference between United States and foreign men. V. Reasons for Attrition We sent surveys to departments and to dropouts, offering a list of possible reasons for withdrawal. 15 Respondents were asked to identify both primary and secondary reasons. Table 4 presents the primary reasons reported by departments for each of the 155 students who left. Unsatisfactory academic progress accounted for 59 percent of all departures—far ahead of personal and family reasons (12 percent) or lost interest in graduate study (10 percent). Program dissatisfaction and financial reasons were rarely mentioned. Fewer students in Tiers 1 and 2—and in Tier 5—left because of academic problems than did students in Tiers 3 and 4. 7 Departmental responses have the advantage of covering all dropouts and are probably more objective, but they also may be less informed, especially about students who leave after a year or less of graduate study, or who leave for subjective reasons that are often unknown to departmental representatives. Student responses, on the other hand, may be influenced by after-the-fact rationalizations and selection bias. Although not reported in our tables, there is, in fact, evidence of selection bias with respect to responses to our dropout surveys. We find that U.S. citizens, those who earned undergraduate degrees from economics-Ph.D.-granting universities, and those who enrolled in Tier 1 or Tier 2 Ph.D. programs are significantly over-represented among respondents, while those with a prior advanced degree in some other field or who enrolled in a Tier 5 school are under-represented. It is thus reassuring that the distribution of department-reported reasons for the 57 respondents returning mailed surveys is strikingly similar to that for all 155 dropouts reported in Table 4. 16 Evidently, the sources of selection bias do not significantly influence the program representatives’ views of why students leave. Unfortunately, there are differences in the reasons for attrition cited by departments and by the dropouts who returned our surveys. Table 5 cross-classifies the primary reasons given by both sets of respondents. The total distribution of reasons cited by departments is reported in the last row of the table; the distribution cited by students is reported in the last column. Cases where departments and students agree are in the diagonal cells. Agreement occurred in only 22 of the 57 cases, the great majority of which cited unsatisfactory academic achievement. 17 Among the 25 dropouts who indicated unsatisfactory academic work as a primary or secondary reason, 14 cited "insufficient mathematical preparation" as the root of their problem. Six cited "difficulty mastering economic theory," and four students cited both. Of the 31 dropouts reporting program dissatisfaction as a primary or secondary reason, 13 identified poor 8 Reasons for dropout (percent distribution)1-67-1516-3031-48�48Full SamplePersonal/family13.318.59.56.019.111.6Unsatisfactory academic work/asked to leave46.740.778.664.038.158.7Dissatisfied with graduate program13.37.40.00.00.02.6Lost interest in graduate study6.711.19.512.04.89.7Financial6.73.70.02.04.82.6Other13.318.52.416.033.314.8Table 4 - Department-reported Primary Reasons for Attrition, by Program RankProgram RankSource: Authors' surveys of graduate programs in economics. The number of dropouts represented in the table is 155. 19 Student-reported reasonPersonal/familyUnsatisfactory academic work/asked to leaveDissatisfied with graduate programLost interest in graduate studyFinancialOtherTotalPersonal/family231100Unsatisfactory academic work/asked to leave1171011Dissatisfied with graduate program220201Lost interest in graduate study061301Financial030000Other130202Total6343815Table 5 - Student- and Department-reported Primary Reasons for AttritionDepartment-reported reasonSource: Authors' surveys of graduate programs in economics and dropouts from graduate programs. Numbers in cells are frequencies and are reported only for dropouts who returned a survey questionnaire. 7217113857 20