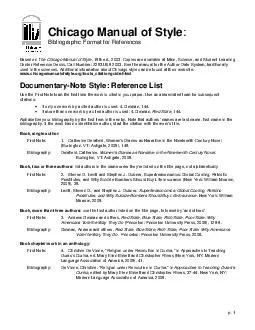
/
October 12, 2015 | Chicago, October 12, 2015 | Chicago,

October 12, 2015 | Chicago, - PowerPoint Presentation

cheryl-pisano
cheryl-pisano . @cheryl-pisano
Follow
375 views
Uploaded On 2018-03-14

October 12, 2015 | Chicago, - PPT Presentation

il Jon Black Lead engineer CIGRE USNC Grid of the Future Symposium ISO New England Net Load Analysis with High Penetration Distributed PV 2 Introduction Installed AC nameplate capacity of distributionconnected PV resources in New England ID: 651081

net load peak system load net system peak loads profiles profile future high significant amounts hours scenarios potential ramping

Share:

Link:

Embed:

Download Presentation from below link

Download Presentation The PPT/PDF document "October 12, 2015 | Chicago," is the property of its rightful owner. Permission is granted to download and print the materials on this web site for personal, non-commercial use only, and to display it on your personal computer provided you do not modify the materials and that you retain all copyright notices contained in the materials. By downloading content from our website, you accept the terms of this agreement.


Presentation Transcript

Slide1

October 12, 2015 | Chicago, il

Jon Black

Lead engineer

CIGRE USNC Grid of the Future Symposium

ISO New England Net Load Analysis with High Penetration Distributed PVSlide2

2

Introduction

Installed AC nameplate capacity of distribution-connected PV resources in New England

is growing rapidly From 44 MW in 2010 to more than 1,000

MW by mid 2015

This growth is expected to continue

ISO-NE

forecasts that PV

capacity will

total almost 2,500

MW by 2024

Analysis of net load profiles in high PV penetration scenarios can assist in identifying key future system characteristics important to system operators and planners

Net

load profiles

were

developed and analyzed

to

help identify

the

system

impacts

of

distributed

PV, including

higher-than-forecasted

amounts

Analysis

and

key results

of

net

load

simulations

for ISO New England with up to 8 GW of distributed PV are

discussedSlide3

3

Background

There is a growing body of both real-world experience and study results regarding

high penetration PV scenarios and the range of potential impacts they could have on

system planning and system operations

(

some which are listed below)

System operations

Short-term load forecasting

Allocation of sufficient reserves & ramping capabilities

Disturbance tolerance & voltage support

System planning

Long-term load forecasting

Determining future system needs (i.e., generation and/or transmission)

Overall operability of systems with very high penetrations (frequency response and transient stability)Slide4

Future net

load scenarios are based on coincident, historical hourly load and PV production data for the years

2012-2014Top plot illustrates the spatial distribution of PV capacity deployed in the region at the end of 2014PV production data accessed via

Solectria Renewables’ SolrenView web-based monitoring system*

665 PV sites totaling 82

MW

ac

(locations shown in bottom plot)

Normalized PV profiles developed for each New England state, blended into a regional profile which was then “

upscaled

” to each PV scenarioExisting PV system design and technology trends are not anticipated to change significantly over the next decade. It is therefore assumed that the upscaling of these profiles yields a reasonable estimate of future profiles associated with larger PV fleets that is adequate for simulation purposes

4

Methodology

*Accessed

via

http://www.solrenview.com

/

Slide5

Fourth highest ISO-NE peak load day ever

As PV penetrations become higher:The timing of peak net loads (

blue dots) becomes later in afternoon/evening

Each successively larger PV scenario contributes less to serving summer peak net loads (which now occur later in the day), due

to the setting of the sun

5

Summer Season Net Load Profile

Friday, July

19, 2013 Slide6

PV does not reduce winter peak

Load reductions from PV can be significant during midday hours on sunny winter daysHigh PV penetrations will increase the need for ramping capability throughout

sunlight hours

6

Winter Season Net Load Profile

Tuesday, January 7, 2014Slide7

Profile sometimes referred to as the “Duck Curve”

Lowest loads often occur on weekend days during spring/autumn and low

demand for heating/coolingIncreased PV will displace significant amounts of synchronous generation

Potential minimum generation emergency events during midday hours (minimum load hours are shown in

green

)

7

Shoulder Season Net Load Profile

Sunday, April 20, 2014Slide8

Timing and Magnitude of Daily Summer Peaks

Scenarios Shown: No PV, 1 GW PV, 2 GW PV, 4 GW PV, 6 GW PV, 8 GW PV

8Slide9

9

Hourly Net Load Ramp RatesApril/May Non-Holiday Weekends

Boxplot shows

the distribution of hourly

net load

ramps without PV (

red

boxes), with 4 GW PV (

green

boxes), and with 8 GW PV (

blue

boxes

)

Large

amounts of distributed PV cause increased net load ramping and a higher frequency of larger magnitude ramps, especially on days exhibiting both high irradiance and low loadSlide10

10

Conclusions

Results highlight significant changes to the overall system and some of the accompanying challenges that would need to be addressed in order to efficiently and reliably integrate the amounts of PV

evaluated:Understanding the effect on the timing and magnitude of summer peak loads;

Ensuring

there is sufficient ramping/cycling capability among non-PV resources to serve the increasingly volatile net

loads;

The

need to mitigate potential reliability issues associated with significant displacement of synchronous generation and increased potential for minimum generation

events

S

imilar analyses on sub-hourly data could yield additional insights, such as potential impacts on regulation requirements