PDF-Assessment and Status Report
Author : conchita-marotz | Published Date : 2016-04-20
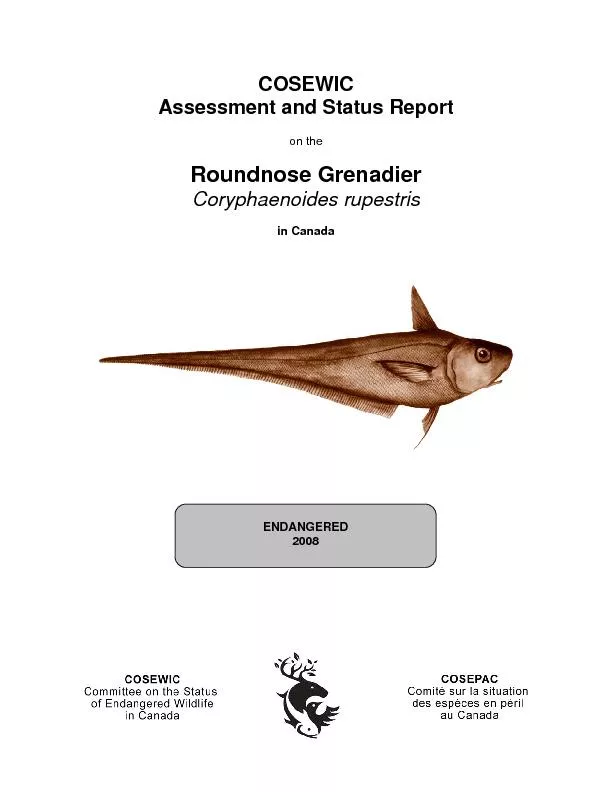
COSEWIC status reports are working documents used in assigning the status of wildlife species suspected of being at risk This report may be cited as follows COSEWIC
Presentation Embed Code
Download Presentation
Download Presentation The PPT/PDF document "Assessment and Status Report" is the property of its rightful owner. Permission is granted to download and print the materials on this website for personal, non-commercial use only, and to display it on your personal computer provided you do not modify the materials and that you retain all copyright notices contained in the materials. By downloading content from our website, you accept the terms of this agreement.
Assessment and Status Report: Transcript
Download Rules Of Document
"Assessment and Status Report"The content belongs to its owner. You may download and print it for personal use, without modification, and keep all copyright notices. By downloading, you agree to these terms.
Related Documents