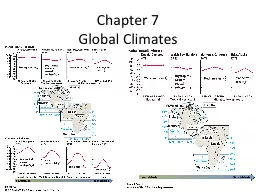
Global Climates What is Climate 30 years of data Temperature amp Precipitation Mean annual temperature Mean annual precipitation How much seasonal variation in temp amp precip Global Temperature Patterns ID: 438061
Download Presentation The PPT/PDF document "Chapter 7" is the property of its rightful owner. Permission is granted to download and print the materials on this web site for personal, non-commercial use only, and to display it on your personal computer provided you do not modify the materials and that you retain all copyright notices contained in the materials. By downloading content from our website, you accept the terms of this agreement.
Slide1
Chapter 7Global ClimatesSlide2
What is Climate?30 years of dataTemperature & Precipitation
Mean annual temperatureMean annual precipitationHow much seasonal variation in temp & precip?Slide3
Global Temperature PatternsLatitudeLocation
Elevation
Cornwall, England, UK
Nunavu
t, Canada
Kluane
National Park, CanadaSlide4
Latitude
© John Wiley & Sons, Inc.Slide5
LocationMaritime vs Continental
© John Wiley & Sons, Inc.Slide6
A location between Sitka, Alaska, and Ft. Vermilion, Alberta, if located at a similar elevation, would most likely have a ____.
a. greater mean annual temperature than Sitkab. greater mean annual temperature than Ft. Vermilionc. greater annual temperature range than Ft. Vermiliond. lower annual temperature range than Sitka
© John Wiley & Sons, Inc.Slide7
Global Precipitation PatternsAir masses (continental vs
maritime air masses)Prevailing winds (atmospheric circulation) Ocean currentsTopographyLatitudePersistent high and low pressure centersSlide8
Air MassesContinental air masses bring drier conditionsMarine air masses bring moisture
Areas that have colliding air masses will have storms
© NG Image Collection
Baffin Island, Canada.
mP
air mass influence.Slide9
Prevailing Winds & Ocean CurrentsWarm or Cold ocean currents determined by prevailing winds
Midlatitude west coast: Drier summers as a result of the cooler, more stable air off the west coastMoist winters as a result of the westerlies and the southward shift of the polar jet stream (L)Midlatitude east coast = wetter summers as a result of the warmer waters of the east coast:
Moist winters as a result of the
westerlies
and the southward shift of the polar jet stream (L)
California coast.Slide10
TopographyMountains increase precipitation on their windward side, decrease precipitation on their leeward side
CA winery nestled in the Coast Ranges gets orographic precipitation.Slide11
LatitudeAreas nearer the equator will have warmer air, which can hold more moisture
Lower latitude locations will, therefore, have more precipitation than higher latitude regions.
Tropical rainforest in Borneo,
Indonesia.Slide12
Persistent High & Low Pressure SystemsLow pressure areas (equator, midlatitudes) have converging, rising air. ITCZ
High pressure areas (subtropics, poles) have diverging, sinking air. STH
Sahara Desert, Africa.Slide13
Three Patterns of Seasonal Rainfall:
Uniform throughout year—ITCZ or marine west coast location (air masses & polar front).
Summer maximum—Asia, air masses from warm waters (eastern U.S.)
Winter maximum—seasonal migration of polar front & STH
Climates With Little to no rainfall:
Arid—STH all year
Semiarid (steppe)—migration of STH and ITCZSlide14
ClimographsSlide15
ClimatologyScience of analyzing climateLook to the past and present to predict the future
Use classification systems: Koppen: uses monthly precip & tempStrahler: uses air mass movement, frontal zones
The
Koppen
Classification System.Slide16
Koppen & Strahler
ComparedKoppen StrahlerLow LatitudesAf—tropical rainforest 1—wet equaotorial
Am—tropical monsoon 2—monsoon & trade-wind coastal
Aw—tropical savanna 3—wet-dry tropical
Midlatitudes
Cs—Mediterranean 7—Mediterranean
Cfa
—Humid subtropical 6—Moist subtropical
Cfb
—Marine west coast 8—Marine west-coast
High Latitudes
Df
—Humid continental 10—Moist continentalDw—Dry winter continental 11—Boreal forest
Polar
ET—Arctic Tundra 12
EF—Polar Ice Cap 13
Arid/Semiarid
BS—Semiarid, steppe 4s, 5s, 9s (the number refers to temp range, latitude)
BW—Desert 4a, 5a, 9aSlide17Slide18Slide19Slide20
Tropical, low latitude climates—no seasons, constant temperature, varying precipitation.
1, 2,3 & 4.Slide21
Uaupes, Brazil (1): Wet equatorial
climate.Slide22
Iquitos, Peru. Wet equatorial climate.Slide23
Yangon, Myanmar (2):
Monsoon and trade-wind coastal climateSlide24
Kochi, India
Monsoon climate.Slide25Slide26
Arusha
, Tanzania (3): wet-dry
Tropical climateSlide27
Timbo
, Guinea, 10N, wet-dry, tropical savanna climate.Slide28
Tropical Dry ClimatesSlide29
In addition to the influence of the STH, deserts are determined by:
--mountain barriers (think of the western U.S.)
--colder ocean currents (think of the coast of Chile)Slide30Slide31
Proximity to cold ocean currents intensifies aridity, but can also produce important coastal fog belts.Slide32
Wadi Halfa, Sudan (4): Tropical DrySlide33
Walvis Bay, Namibia (4): Tropical dry on a coastSlide34
Visualizing Physical GeographyCopyright © 2012 John Wiley & Sons, Inc.
Midlatitude Climates
8. Marine West-coast
9. Dry midlatitude
Five
midlatitude climates:
5. Dry Subtropical
6. Moist Subtropical
7. Mediterranean
© A. N.
StrahlerSlide35
Midlatitude
Climates—mild winters, varying
precipitation.
5, 6, 7, 8, 9
Any pattern to where
these
climates are located?
Why do
these
climates extend into the upper latitudes on west coasts (northern
hemisphere) but not on east coasts?
San Francisco, CA
Columbia,South Carolina
Chengdu, ChinaSlide36Slide37
6: Moist subtropicalSlide38
Charleston, South CarolinaSlide39Slide40
8: Marine
West CoastRain all year, cool
Wettest climate in the
mid-latitudesSlide41
Vancouver, British ColumbiaSlide42
7: MediterraneanSlide43
Monterey, CaliforniaSlide44
Dry climates in the midlatitudesDry subtropical (5) & Dry midlatitude (9)Slide45
Dry Subtropical (5): Yuma, ArizonaSlide46
Dry Midlatitude (9): Pueblo, ColoradoSlide47
High latitude and severe winter climates (10, 11, 12 & 13): all have very cold winters, varying precipitation.
Churchill, Manitoba
New York, NY
Moscow, Russia
Verkhoyansk, RussiaSlide48
Moist Continental (10): Madison, WisconsinSlide49
New York, NY, (10)Slide50Slide51
Fort Vermillion,Alberta, Canada
(11)Slide52Slide53Slide54Slide55
Upernavik
, Iceland (12)
Eismitte
, Greenland (13)Slide56
Visualizing Physical GeographyCopyright © 2012 John Wiley & Sons, Inc.
Climate Change
If the Arctic continues to warm, which of the following transformations is most likely?
a. The tundra climate region will expand in all directions.
b
. The boreal forest climate will expand in all directions.
c
. The boreal forest climate will move into areas once considered tundra climate.
d
. The tundra climate will move into areas once considered boreal forest climate.
© John Wiley & Sons, Inc.
©John Wiley & Sons, IncSlide57