PPT-Great Plains Landscape Conservation Cooperative Monitoring Grid
Author : conchita-marotz | Published Date : 2019-10-31
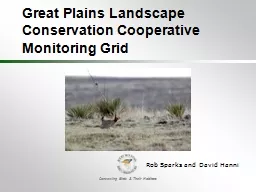
Great Plains Landscape Conservation Cooperative Monitoring Grid Rob Sparks and David Hanni Presentation Outline Current RMBO monitoring programs GPLCC standardized
Presentation Embed Code
Download Presentation
Download Presentation The PPT/PDF document "Great Plains Landscape Conservation Coop..." is the property of its rightful owner. Permission is granted to download and print the materials on this website for personal, non-commercial use only, and to display it on your personal computer provided you do not modify the materials and that you retain all copyright notices contained in the materials. By downloading content from our website, you accept the terms of this agreement.
Great Plains Landscape Conservation Cooperative Monitoring Grid: Transcript
Download Rules Of Document
"Great Plains Landscape Conservation Cooperative Monitoring Grid"The content belongs to its owner. You may download and print it for personal use, without modification, and keep all copyright notices. By downloading, you agree to these terms.
Related Documents