/
NHTSAs National Center for Statistics and Analysis  New Jersey Avenue SE NHTSAs National Center for Statistics and Analysis  New Jersey Avenue SE

NHTSAs National Center for Statistics and Analysis New Jersey Avenue SE - PDF document

conchita-marotz
conchita-marotz . @conchita-marotz
Follow
422 views
Uploaded On 2014-11-11

NHTSAs National Center for Statistics and Analysis New Jersey Avenue SE - PPT Presentation

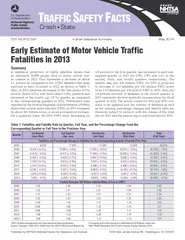
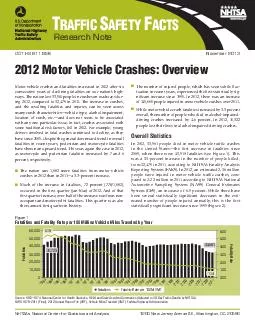
Washington DC 20590 RAFFIC AFETY ACTS Research Note DOT HS 811 856 November 2013 2012 Motor Vehicle Crashes Overview Motor vehicle crashes and fatalities increased in 2012 after six consecutive years of declining fatalities on our nations high ways ID: 10317

Washington 20590 RAFFIC

Share:

Link:

Embed:

Download Presentation from below link

Download Pdf The PPT/PDF document "NHTSAs National Center for Statistics an..." is the property of its rightful owner. Permission is granted to download and print the materials on this web site for personal, non-commercial use only, and to display it on your personal computer provided you do not modify the materials and that you retain all copyright notices contained in the materials. By downloading content from our website, you accept the terms of this agreement.


Presentation Transcript

DOT HS 811 856 November 2013 2012 Motor Vehicle Crashes: OverviewMotor vehicle crashes and fatalities increased in 2012 after six consecutive years of declining fatalities on our nation’s highways. The nation lost 33,561 people in crashes on roadways during 2012, compared to 32,479 in 2011. The increase in crashes, and the resulting fatalities and injuries, can be seen across many crash characteristics—vehicle type, alcohol impairment, location of crash, etc.—and does not seem to be associated with any one particular issue. In fact, crashes associated with people lost their lives in alcohol-impaired-driving crashes. Overall StatisticsIn 2012, 33,561 people died in motor vehicle trafc crashes in the United States—the rst increase in fatalities since 2005, when there were 43,510 fatalities (see Figure 1). This was a 3.3-percent increase in the number of people killed, from 32,479 in 2011, according to NHTSA’s Fatality Analysis Reporting System (FARS). In 2012, an estimated 2.36 million people were injured in motor vehicle trafc crashes, compared to 2.22 million in 2011 according to NHTSA’s National Automotive Sampling System (NASS) General Estimates 60,00050,00040,000FatalitiesFatality Rate30,00020,00010,000033,5611963196519671969197119731975197719791981198319851987198919911993199519971999 Fatality Rate per 100M VMTFatalities NHTSA’s National Center for Statistics and Analysis 200 New Jersey Avenue SE., Washington, DC 20590 T RAFFIC SAFETY FACTSResearch Note 5.1841,7231.14 Source: 1963–1974: National Center for Health Statistics, HEW, and State Accident Summaries (Adjusted to 30-Day Trafc Deaths by NHTSA); FARS 1975–2011 (Final), 2012 Annual Report File (ARF); Vehicle Miles Traveled (VMT): Federal Highway Administration. 2 Fatality and Injury Rates The fatality rate per 100 million vehicle miles traveled (VMT) increased 3.6 percent to 1.14 in 2012 (Table 1). The overall injury rate increased by 6.7 percent from 2011 to 2012. The 2012 rates are based on VMT estimates from the Federal Highway Administration’s (FHWA) August 2013 Trafc Volume Trends (TVT). Overall 2012 VMT increased by 0.3 percent from 2011 VMT—from 2,946 billion to 2,954 billion. VMT data will be updated when FHWA releases the 2012 Annual Highway Statistics. Table 1 Fatality and Injury Rates per 100 Million VMT 2011 2012 Change % Change Fatality Rate 1.10 1.14 0.04 3.6% Injury Rate 75 80 5 6.7% Source: FARS, GES, and FHWA VMT (August 2013 TVT) Occupants and Nonoccupants Motor vehicle crash fatalities and injuries increased in 2012, as shown in Table 2 below. Total fatalities increased by 3.3 percent and increased among all person type categories. The estimated number of people injured increased by 6.5 percent, a statisti - cally signicant change from 2011. There were 351 more passenger vehicle occupant fatali - ties (+1.6%) in 2012 than in 2011, the rst increase since 2002. Fatalities in passenger cars increased 2.1 percent and in light trucks 1.0 percent. Large-truck occupant fatalities increased for a third year after a large drop in fatalities from 2008 to 2009. In 2012, there was an 8.9-percent increase in large-truck occupant fatalities and an 8.7-percent increase in large-truck occupants injured from 2011. Motorcyclist fatalities increased in 2012 to 4,957, accounting for 15 percent of total fatalities for the year. Injured motorcyclists increased by an estimated 12,000 in 2012, a statistically signicant difference. Among nonoccupants, pedestrian fatalities increased by 6.4 percent while pedalcyclist fatalities increased by 6.5 percent from 2011 to 2012. Table 2 Occupants and Nonoccupants Killed and Injured in Trafc Crashes Description Killed Injured 2011 2012 Change % Change 2011 2012 Change % Change Total* 32,479 33,561 1,082 3.3% 2,217,000 2,362,000 145,000 6.5% Occupants Passenger Vehicles 21,316 21,667 351 1.6% 1,968,000 2,091,000 123,000 6.3% Passenger Cars 12,014 12,271 257 2.1% 1,240,000 1,328,000 88,000 7.1% Light Trucks 9,302 9,396 94 1.0% 728,000 762,000 34,000 4.7% Large Trucks 640 697 57 8.9% 23,000 25,000 2,000 8.7% Motorcycles 4,630 4,957 327 7.1% 81,000 93,000 12,000 15% Nonoccupants Pedestrians 4,457 4,743 286 6.4% 69,000 76,000 7,000 10% Pedalcyclists 682 726 44 6.5% 48,000 49,000 1,000 2.1% Other/Unknown 200 223 23 — 9,000 10,000 1,000 — Source: Fatalities—FARS 2011 (Final), 2012 (ARF), Injured—NASS GES 2011, 2012 Annual Files *Total includes occupants of buses and other/unknown occupants not shown in table. Changes in injury estimates shown in bold are statistically signicant. Figure 2 People Injured and Injury Rate per 100 Million Vehicle Miles Traveled by Year 4,000,0003,500,0003,000,0002,000,0001,500,0001,000,000500,0000People Injured1988198919901991199219931994199519961997199819992000200120022003200420052006200720082009201020112012Injury Rate per 100M VMTPeople Injured1693,416,000Injury Rate18016010080602002,362,00080 Source: NASS GES 1988–2012; Vehicle Miles Traveled (VMT): Federal Highway Administration. 3 Change in Composition of Fatalities The composition of the fatalities in 2003 and 2012 is shown in Figure 3. There were major changes in proportions of fatalities among passenger vehicles (75% down to 65%), motorcyclists (up from 9% to 15%) and nonoccupants (up from 13% to 17%). Much of this shift is because of the large decrease in the num - ber of passenger vehicle occupant fatalities (down by more than 10,000 over the 10-year period). However, there has also been a large increase (1,243 more) in the number of motorcyclist fatali - ties during the same time period. Figure 3 Composition of Fatalities, 2003 and 2012 13%20032012Passenger Vehicle OccupantsLarge Trucks, Buses and Other Vehicle OccupantsMotorcyclistsPedestrians, Bicyclists and Other Nonoccupants17%3%4%9%15%75%65% Quarterly Data In order to gain insight into the increases in fatalities, quarterly data for 2011 and 2012 is shown in the top half of Table 3. In 2012 there were 1,082 more fatalities than in 2011, and 778 of these—72 percent— occurred during the rst three months. Furthermore, even though these are winter months, the larg - est percentage increases occurred for motorcyclists and nonoc - cupants. According to the National Oceanic and Atmospheric Administration’s (NOAA) National Climate Data Center, 2012 was the warmest rst quarter on record, going back to 1897 (www.ncdc.noaa.gov/cag). This may explain some of the increase in fatalities in 2012, especially the number and pattern of those during January through March. Notice that quarterly uctuations in each category follow similar patterns in both 2011 and 2012. For example, in each year, the numbers of pedalcyclist fatalities increases from the rst quarter through the third quarter, then decreases in the fourth quarter. These patterns of increasing and decreasing fatalities from one quarter to another are the same for both 2011 and2012. Looking to the bottom half of Table 3, notice that except for large truck occupants, fatalities in each type had the great - est percent increase from 2011 to 2012 in the rst quarter, a much smaller percent change in the second quarter, nearly no change in the third quarter, and a small increase or, in some cases, a decrease in the fourth quarter. Large-truck occupant fatalities show a different pattern, but given that the number of fatalities is relatively small in comparison, this variability is not unexpected. Alcohol-Impaired-Driving Fatalities Alcohol-impaired-driving fatalities increased by 4.6 percent in 2012 (Table 4), accounting for 31 percent of overall fatalities. An alcohol-impaired-driving fatality is dened as a fatality in a crash involving a driver or motorcycle rider (operator) with Table 3 Quarterly Fatalities by Occupant and Nonoccupant Type Quarter Passenger Vehicle Occupants Motorcyclists Large Truck Occupants Pedestrians Pedalcyclists Total 2011 Jan–Mar 4,756 582 130 1,014 114 6,726 Apr–Jun 5,275 1,506 159 891 179 8,227 Jul–Sep 5,518 1,759 190 1,053 225 8,984 Oct–Dec 5,767 783 161 1,499 164 8,542 2012 Jan–Mar 5,098 748 138 1,217 150 7,504 Apr–Jun 5,405 1,649 175 958 189 8,583 Jul–Sep 5,595 1,759 198 1,119 223 9,127 Oct–Dec 5,569 801 186 1,449 164 8,347 Changes from 2011 to 2012 Number Jan–Mar 342 166 8 203 36 778 Apr–Jun 130 143 16 67 10 356 Jul–Sep 77 0 8 66 -2 143 Oct–Dec -198 18 25 -50 0 -195 Percent Jan–Mar 7.2% 28.5% 6.2% 20.0% 31.6% 11.6% Apr–Jun 2.5% 9.5% 10.1% 7.5% 5.6% 4.3% Jul–Sep 1.4% 0.0% 4.2% 6.3% -0.9% 1.6% Oct–Dec -3.4% 2.3% 15.5% -3.3% 0.0% -2.3% Source: FARS 2011 (Final), 2012 (ARF) 4 a BAC of .08 g/dL or greater. The number of alcohol-impaired drivers in fatal crashes increased for most vehicle types, with the largest increase among drivers of large trucks (86%). Note that the number of large-truck drivers is small relative to the other vehicle types, making it subject to greater variability. Table 4 Total and Alcohol-Impaired (AI) Driving Fatalities* 2011 2012 Change % Change Total Fatalities 32,479 33,561 1,082 3.3% AI Driving Fatalities 9,865 10,322 457 4.6% Alcohol-Impaired Drivers in Fatal Crashes by Vehicle Type Passenger Car 4,103 4,104 1 0.0% Light Truck - Van 256 267 11 4.3% Light Truck - Utility 1,410 1,483 73 5.2% Light Truck - Pickup 1,877 1,946 69 3.7% Motorcycles 1,397 1,390 -7 -0.5% Large Trucks 43 80 37 86% Source: FARS 2011 (Final), 2012 (ARF) *See denition in text. Crash Type The number of motor vehicle crashes, by crash type and sever - ity, is presented in Table 5. The total number of police-reported trafc crashes increased by 3.1 percent from 2011 to 2012. The estimated increase in injury crashes is statistically signicant; this is the rst time this has happened since 1995. Because FARS data is a census of fatal crashes, no signicance testing is required. Table 5 Number of Crashes, by Crash Type Crash Type 2011 2012 Change % Change Fatal Crashes 29,867 30,800 933 3.1% Non-Fatal Crashes 5,308,000 5,584,000 276,000 5.2% Injury Crashes 1,530,000 1,634,000 104,000 6.8% Property-Damage-Only 3,778,000 3,950,000 172,000 4.6% Total Crashes 5,338,000 5,615,000 277,000 5.2% Source: FARS 2011 (Final), 2012 (ARF) Bold gures are statistically signicant. Restraint Use and Time of Day Among fatally injured passenger vehicle occupants, more than half (52%) of those killed in 2012 were unrestrained (Table 6). Although there were 351 more passenger vehicle occupant fatalities in 2012, we know the time of day of the crash for only 305 of them—an increase of 8 (3% of the 305) during the day and 297 (97%) during the night. Among the 297 increase in nighttime fatalities, a large proportion (229, or 77%) was among restrained passenger vehicle occupants. The number of restrained passenger vehicle occupants killed in daytime crashes actually decreased by 39 people. Of passenger vehicle occupants killed at night, 61 percent were unrestrained, com - pared to 43 percent during the day. Table 6 Passenger Vehicle Occupant Fatalities, by Restraint Use and Time of Day Type 2011 2012 Change % Change # % # % Fatalities 21,316 21,667 351 1.6% Restraint Used 10,255 48% 10,478 48% 223 2.2% Restraint Not Used 11,061 52% 11,189 52% 128 1.2% Day 10,999 52% 11,007 51% 8 0.1% Restraint Used 6,280 57% 6,241 57% -39 -0.6% Restraint Not Used 4,719 43% 4,766 43% 47 1.0% Night 10,183 48% 10,480 48% 297 2.9% Restraint Used 3,910 38% 4,139 39% 229 5.9% Restraint Not Used 6,273 62% 6,341 61% 68 1.1% Source: FARS 2011 (Final), 2012 (ARF); Day: 6 a.m. to 5:59 p.m.; Night: 6 p.m. to 5:59 a.m.; Total fatalities include those at unknown time of day; unknown restraint use has been distributed proportionally across known use. Fatal Crashes Involving Large Trucks There was a 3.7-percent increase in the number of people killed in crashes involving large trucks. Looking at only this one per - centage masks the changes across fatality categories. The num - ber of nonoccupant fatalities is the only category of fatalities that declined from 2011 to 2012; a decline of 11 percent. All other categories of fatalities in large-truck crashes increased (Table7). Large-truck occupants in single-vehicle crashes increased by the smallest percentage (3.9%), while those in multivehicle crashes increased by the largest (18%). Note that the number of fatal crashes involving large trucks is relatively small, so such variability in the number of fatalities is not unexpected. Table 7 Persons Killed in Large-Truck Crashes Type 2011 2012 Change % Change Truck Occupants 640 697 57 8.9% Single-Vehicle 408 424 16 3.9% Multivehicle 232 273 41 18% Other Vehicle Occupants 2,713 2,843 130 4.8% Nonoccupants 428 381 -47 -11% Total 3,781 3,921 140 3.7% Source: FARS 2011 (Final), 2012 (ARF) Crash Location Fatalities in rural crashes increased by 2.3 percent (Table 8) while those in urban crashes increased by 4.9 percent. People killed in roadway departure crashes increased by 3.4 percent and intersection crashes increased by 5.4 percent. Following are the denitions used for roadway departure and intersec - tion crashes as dened by FHWA. 5 This research note and other general information on highway trafc safety may be accessed at: www-nrd.nhtsa.dot.gov/CATS/index.aspx Roadway Departure Crash: A non-intersection crash in which a vehicle crosses an edge line, a centerline, or leaves the trav - eled way. Includes intersections at interchange areas. Types of Crashes Fitting the Denition: Non-intersection fatal crashes in which the rst event for at least one of the involved vehicles: ran-off-road (right or left); crossed the centerline or median; went airborne; or hit a xed object. Intersection: Non-interchange; intersection or intersection-related. Table 8 People Killed in Motor Vehicle Trafc Crashes, by Roadway Function Class, Roadway Departure and Relation to Junction 2011 2012 Change % Change Total 32,479 33,561 1,082 3.4% Roadway Function Class Rural 17,769 18,170 401 2.3% Urban 14,575 15,296 721 4.9% Roadway Departure* Roadway Departure* 18,273 18,887 614 3.4% Relation to Junction Intersection* 8,317 8,766 449 5.4% Source: FARS 2011 (Final), 2012 (ARF) Total fatalities include those with unknown Roadway Function Class. *See denitions in text. Other Facts  The increase in passenger vehicle occupant fatalities is the rst since 2002. Even with this increase, passenger vehicle occupant fatalities are down 34 percent from where they were in 2002.  There were 10 times as many unhelmeted motorcyclist fatal - ities in States without universal helmet laws (1,858 unhel - meted fatalities) as in States with universal helmet laws (178 unhelmeted fatalities) in 2012. These States were nearly equivalent with respect to total resident populations.  While fatalities from alcohol-impaired driving have increased from 2011 to 2012, fatalities from crashes involving young drivers and alcohol have decreased, by 15 percent (16- to 20-year-old drivers with .01+ BAC).  Males have consistently comprised about 70 percent of motor vehicle fatalities for decades.  Although most age groups had increased fatalities in 2012, the 10-to-15 year group saw a decrease of 3.9 percent, and the 16-to-20 year group decreased by 5.7 percent. There were half a percent fewer fatalities over age 74 in 2012. All other age groups increased.  Sixty-one percent of large-truck occupants killed in 2012 died in single-vehicle crashes. State-by-State Distribution of Fatalities and Alcohol-Impaired Driving Crash Fatalities Table 9 presents the total number of motor vehicle crash fatali - ties for 2011 and 2012, the change in the number of fatalities, and the percentage change for each State, the District of Columbia, and Puerto Rico. Thirteen States, Puerto Rico, and the District of Columbia had reductions in the number of fatalities. In 2012, the largest reduction was in Mississippi, with 48 fewer fatali - ties. There were 37 States with more motor vehicle fatalities in 2012 than 2011. Texas had the largest increase, with 344 addi - tional fatalities, and Ohio had 106 more fatalities than in 2011. Nationwide, about one-third (31%) of the total fatalities were in alcohol-impaired-driving crashes. Eighteen States and the District of Columbia saw declines in the number of alcohol- impaired-driving fatalities. New Jersey had the largest decrease, with 30 fewer lives lost in alcohol-impaired-driving crashes in 2012. Thirty-two States and Puerto Rico saw increases in alco - hol-impaired driving fatalities, with the largest increase of 80 fatalities in Texas. Additional State-level data is available at NCSA’s State Trafc Safety Information Web site, which can be accessed at: www-nrd.nhtsa.dot.gov/departments/nrd-30/ncsa/STSI/ USA%20WEB%20REPORT.HTM . NHTSA’s Fatality Analysis Reporting System is a census of all crashes of motor vehicles traveling on public roadways in which a person died within 30 days of the crash. Data for the NASS GES comes from a nationally representa - tive sample of police-reported motor vehicle crashes of all types, from property-damage-only to fatal. The information in this Research Note represents only major ndings from the 2012 FARS and GES les. Additional information and details will be available at a later date. 6 Table 9 Total and Alcohol-Impaired Driving Fatalities, 2011 and 2012, by State State 2011 2012 2011 to 2012 Change Total Fatalities Alcohol-Impaired-Driving Fatalities Total Fatalities Alcohol-Impaired-Driving Fatalities Total Fatalities Alcohol-Impaired-Driving Fatalities # % # % Change % Change Change % Change Alabama 895 261 29% 865 257 30% -30 -3.4% -4 -1.5% Alaska 72 21 29% 59 15 25% -13 -18% -6 -29% Arizona 826 212 26% 825 227 28% -1 -0.1% 15 7.1% Arkansas 551 154 28% 552 143 26% 1 0.2% -11 -7.1% California 2,816 774 27% 2,857 802 28% 41 1.5% 28 3.6% Colorado 447 160 36% 472 133 28% 25 5.6% -27 -17% Connecticut 221 94 42% 236 85 36% 15 6.8% -9 -9.6% Delaware 99 41 41% 114 34 30% 15 15% -7 -17% Dist of Columbia 27 8 29% 15 4 27% -12 -44% -4 -5% Florida 2,400 694 29% 2,424 697 29% 24 1.0% 3 0.4% Georgia 1,226 271 22% 1,192 301 25% -34 -2.8% 30 11% Hawaii 100 45 45% 126 51 41% 26 26% 6 13% Idaho 167 50 30% 184 54 29% 17 10% 4 8.0% Illinois 918 278 30% 956 321 34% 38 4.1% 43 15% Indiana 751 207 28% 779 228 29% 28 3.7% 21 10% Iowa 360 83 23% 365 92 25% 5 1.4% 9 11% Kansas 386 108 28% 405 98 24% 19 4.9% -10 -9.3% Kentucky 720 172 24% 746 168 23% 26 3.6% -4 -2.3% Louisiana 680 219 32% 722 241 33% 42 6.2% 22 10% Maine 136 23 17% 164 49 30% 28 21% 26 113% Maryland 485 161 33% 505 160 32% 20 4.1% -1 -0.6% Massachusetts 374 126 34% 349 123 35% -25 -6.7% -3 -2.4% Michigan 889 256 29% 938 259 28% 49 5.5% 3 1.2% Minnesota 368 109 30% 395 114 29% 27 7.3% 5 4.6% Mississippi 630 159 25% 582 179 31% -48 -7.6% 20 13% Missouri 786 258 33% 826 280 34% 40 5.1% 22 8.5% Montana 209 82 39% 205 89 44% -4 -1.9% 7 8.5% Nebraska 181 45 25% 212 74 35% 31 17% 29 64% Nevada 246 70 28% 258 82 32% 12 4.9% 12 17% New Hampshire 90 27 30% 108 32 30% 18 20% 5 19% New Jersey 627 194 31% 589 164 28% -38 -6.1% -30 -15% New Mexico 350 104 30% 365 97 27% 15 4.3% -7 -6.7% New York 1,171 328 28% 1,168 344 29% -3 -0.3% 16 4.9% North Carolina 1,230 359 29% 1,292 402 31% 62 5.0% 43 12% North Dakota 148 63 42% 170 72 42% 22 15% 9 14% Ohio 1,017 310 30% 1,123 385 34% 106 10% 75 24% Oklahoma 696 222 32% 708 205 29% 12 1.7% -17 -7.7% Oregon 331 96 29% 336 86 26% 5 1.5% -10 -10% Pennsylvania 1,286 398 31% 1,310 408 31% 24 1.9% 10 2.5% Rhode Island 66 26 39% 64 24 38% -2 -3.0% -2 -7.7% South Carolina 828 309 37% 863 358 41% 35 4.2% 49 16% South Dakota 111 33 29% 133 45 33% 22 20% 12 36% Tennessee 937 259 28% 1,014 295 29% 77 8.2% 36 14% Texas 3,054 1,216 40% 3,398 1,296 38% 344 11% 80 6.6% Utah 243 54 22% 217 34 16% -26 -11% -20 -37% Vermont 55 18 33% 77 23 30% 22 40% 5 28% Virginia 764 228 30% 777 211 27% 13 1.7% -17 -7.5% Washington 454 157 35% 444 145 33% -10 -2.2% -12 -7.6% West Virginia 338 93 28% 339 95 28% 1 0.3% 2 2.2% Wisconsin 582 197 34% 615 200 33% 33 5.7% 3 1.5% Wyoming 135 38 28% 123 40 32% -12 -8.9% 2 5.3% National 32,479 9,865 30% 33,561 10,322 31% 1,082 3.3% 457 4.6% Puerto Rico 361 103 28% 347 104 30% -14 -3.9% 1 1.0% Source: FARS 2011 (Final), 2012 Annual Report File (ARF) 10089-111213-v3 NHTSA’s National Center for Statistics and Analysis1200 New Jersey Avenue SE., Washington, DC 20590 NHTSA’s National Center for Statistics and Analysis1200 New Jersey Avenue SE., Washington, DC 20590