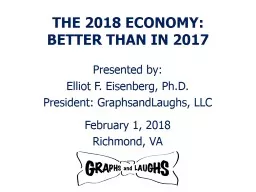
President GraphsandLaughs LLC February 1 2018 Richmond VA THE 2018 ECONOMY BETTER THAN IN 2017 The Economy is Solid GDP CIGXM The Stock Market Is Doing Amazingly Well Households are Repairing their Balance Sheets ID: 791818
Download The PPT/PDF document "Presented by : Elliot F. Eisenberg, Ph...." is the property of its rightful owner. Permission is granted to download and print the materials on this web site for personal, non-commercial use only, and to display it on your personal computer provided you do not modify the materials and that you retain all copyright notices contained in the materials. By downloading content from our website, you accept the terms of this agreement.
Slide1
Presented by: Elliot F. Eisenberg, Ph.D. President: GraphsandLaughs, LLCFebruary 1, 2018Richmond, VA
THE 2018 ECONOMY: BETTER THAN IN 2017
Slide2The Economy is Solid!GDP = C+I+G+(X-M)
Slide3The Stock Market Is Doing Amazingly Well
Slide4Households are Repairing their Balance SheetsTrillions in Net Worth Recovered, at a New Record Level HNONWRQ027S
Slide5Households Deleveraging is Done!!!!!!Lack of income growth hurts, but debt is growing once again. Above prior peak
Slide6University of MI Consumer Confidence is GoodReading is quite high.
Slide7Small Business Confidence is OKSpectacular rise since election.
Slide8Hotel Occupancy Rates are Excellent!Occupancy is superb as is the ADR and the RevPAR
Slide9Las Vegas Attendance RocksThe gamblers are back, the conventioneers are too!
Slide10US Light Vehicle Sales are Down but are OK
Slide11Residential Remodeling –Rising Nicely Owner-Occupied Improvements. Higher prices and less sales boost renovation
Skip to main content
Joint Center for Housing Studies, Harvard University
About Us
Research
Events
Students
News & Media
After a Strong Start, Remodeling Activity Should See Some Easing Later in the Year
MEDIA
Thursday, April 17, 2014
Cambridge, MA – Solid growth is expected in the home remodeling market this year but momentum should begin to moderate in the fourth quarter, according to the
Leading Indicator of Remodeling Activity (LIRA)
released today by the Remodeling Futures Program at the Joint Center for Housing Studies of Harvard University. Sluggishness in the housing market and specifically in home sales may result in a deceleration of home improvement spending from double-digit annual growth through the third quarter to a year-over-year gain in the high single digits by the end of the year.
“The housing recovery has at least temporarily lost some of its momentum,” says Eric S. Belsky, managing director of the Joint Center. “And as a result, remodeling spending is expected to follow suit and see slower growth beginning later this year.”
“Home improvement spending has already recovered a significant share of its losses from the downturn,” says Kermit Baker, director of the Remodeling Futures Program at the Joint Center. “As spending moves into the next phase, we expect to see recent double-digit growth tail off to its longer-term average in the mid-single-digit range.”
PLEASE NOTE:
An important change was made to the LIRA estimation model this quarter. With the upheaval in financial markets in recent years, the traditional relationship between interest rates and home improvement spending has significantly deteriorated. As a result, long-term interest rates have been removed from the LIRA estimation model. For more information on the implications of this change, please
visit our blog
.
Click to view/save LIRA graphic.
More information about the LIRA (FAQ, etc.) Click to view historical LIRA data and calculation methodologyThe Leading Indicator of Remodeling Activity (LIRA) is designed to estimate national homeowner spending on improvements for the current quarter and subsequent three quarters. The indicator, measured as an annual rate-of-change of its components, provides a short-term outlook of homeowner remodeling activity and is intended to help identify future turning points in the business cycle of the home improvement industry. The development of the LIRA is detailed in “Developing a Leading Indicator for the Remodeling Industry” (JCHS Research Note N07-1). In July 2008, the LIRA was re-benchmarked due to changes in the underlying reference series. These changes are explained in “Addendum to Research Note N07-1: Re-Benchmarking the Leading Indicator of Remodeling Activity” (JCHS Research Note N08-1). The LIRA is released by the Remodeling Futures Program at the Joint Center for Housing Studies of Harvard University in the third week after each quarter’s closing. The next LIRA release date is July 24, 2014.The Remodeling Futures Program, initiated by the Joint Center for Housing Studies in 1995, is a comprehensive study of the factors influencing the growth and changing characteristics of housing renovation and repair activity in the United States. The Program seeks to produce a better understanding of the home improvement industry and its relationship to the broader residential construction industry.For more information, please contact:Kerry Donahue, (617) 495-7640, kerry_donahue@harvard.edu Search JCHSSearch Connect with JCHSJCHS on TwitterRead our blogFeatured Publication The U.S. housing recovery should regain its footing, but also faces a number of challenges, concludes the 2014 State of the Nation’s Housing report. Tight credit, still elevated unemployment, and mounting student loan debt among young Americans are moderating growth and keeping millennials and other first-time homebuyers out of the market.The Joint Center for Housing Studies is a collaborative unit affiliated with the Harvard Graduate School of Design and the Harvard Kennedy School. JOIN OUR MAILING LIST© 2013 Harvard Joint Center for Housing Studies | 1033 Massachusetts Avenue, 5th Floor, Cambridge, MA 02138 | 617.495.7908 | jchs@harvard.edu
Slide12Let’s Buy a Horse
Slide13Let’s Buy a Plane
Slide14Annual Y-o-Y Percent Change in PCEA solid albeit lackluster growth rate of 2.7%
Slide15Drilling Activity is UpNumber of oil rigs is now rising as a result of the rising price of crude
Slide16Corporate Profits are Again Rising After Weakening
Slide17ISM Manufacturing Numbers are StrongManufacturing is not as important as it was in the past. It is however booming!
Slide18ISM Non-Manufacturing Numbers are GoodService sector is doing well
Slide19OK. Now, Look at Capital Goods Orders! Minus defense and aircraft
Slide20Tax Cuts Are Not Likely to Really Help the Economy
Slide21The Dollar is Weakening Against all Currencies Peaked in January 2017. A weaker dollar is a concern WeakStronger
Strong
Slide22Western Democracies are All Growing! Both emerging markets and developed look increasingly better
Slide23GDP Growth Goes Nowhere SlowlyTrump may boost GDP by 25 or 30 bps in 2018
Slide24GDP Can’t Grow Much Faster!
Slide25Best of All, No Recession is in the Cards!Yield Curve Inversion Test: 1-Year Treasury Yield – 10-Year Treasury Yield
Slide26Labor Markets: They’re on the mend
Slide27Historical Job Growth Y-o-Y Total employment growth is slowing. We are running out of workers
Slide28STEADY Labor Market Improvement: Involuntary Separation Long Term Trends: 1967-2017 Initial claims below 300K for 149 straight weeks!
Slide29Tighter Labor Market than Perceived? For Sure! The number of unemployed per job opening is at a record low!
Slide30Wage Growth is Weak, But...
Slide31Y-o-Y Percent Change in Hourly EarningsDespite a very low unemployment rate, wages growth is weak
Slide32Changes in Median Wage Growth Looks Good!Looks only at those continuously full-time employed
Slide33Labor Productivity Growth Remains DismalMaybe this is why
Slide34Labor Productivity Growth is Dismal
Slide35Inflation?What Inflation!
Slide36CPI: Inflationary Pressures are FlatRemove Healthcare, and apparel are now weak. Was drugs, cellphones and autos
Slide37Core PCE Price Index: Inflation is Very Tame! Surprising this late in the business cycle.
Slide38Federal Reserve BehaviorRates Will Rise.But, How Fast?
Slide39Taller Fed Chair, Higher Rates?
Slide40Federal Reserve BehaviorMost likely scenarioFed funds is currently 1.375% 12/31/18: 2.125% (50%/50%) 10-yr Treasury @ 2.90% 12/31/19: 2.625% 10-yr Treasury @ 3.20%12/31/20: 3.125% 10-yr Treasury @ 3.50%Balance sheet keeps shrinking.
Slide41Real Estate?It’s Improving but In Fits and Starts!
Slide42Residential Fixed Investment Slowly Rises!Non-residential is up 5%, public is down 10% and residential is down 22% from peak
Slide43Bigger Houses Only!
Slide44Regulation is a Killer
Slide45Input Costs are Way Up due to Policy and ChinaPrices are up 25% to 36% Y-o-Y. End of NAFTA is making this worse
Slide46Labor Shortage is Quite Serious Average annual wage increase for construction workers is still just 3.5%
Slide47Huge Influx of Foreign Buyers
Slide48Existing Inventory is ShrinkingDown 6.4% Y-o-Y and down for 31 straight months . Higher prices should help, but rental conversions especially at lower price points, aging in place & mortgage lock-in are hurting
Slide49Price Growth Appears to be Rising? Prices rise faster than wages! Y-o-Y prices up 6.0%, 6.4% or 6.2% depending on the measure
Slide50Credit is Tight: Thus, No Housing BubbleAll FICO Scores are up about 40 points
Slide51Single-Family and Multifamily Starts – A Slow RecoveryLack of lots, gun shy lenders, high prices, SF looks decent
Slide52House Prices by GeographyDC, CA and HI are the most expensive. NY, MA and CT follow
Slide53Average Property Tax Rate by StateMinnesota is close to the middle
Slide54MID Average Savings by Homeowner
Slide55Top Marginal Income Tax Rate by StateMinnesota is fourth highest!
Slide56Impact of the Mortgage Interest Deduction by GeographyA house costing up to $900,000 is still somewhat protected.
Slide57Refinance Activity is Quite Flat! 2018 refi activity falls to $450 billion from $600. Share falls from 37% to 27%.
Slide58MBA Mortgage Purchase Apps Flatten1st time applications up 7% Y-o-Y, at level of late 1990s!The recent decline has reversed. 2018 volume looks to be slightly better than 2017
Slide59Existing Home Sales Improve?
Slide60Recent Existing Home SalesSolid and steady improvement until late 2016. Since then, largely flat.
Slide61Pending Home Sales are SlumpingHigh prices due to low inventories are finally being felt
Slide62Demographics Will Start to Really Help Beginning to approach the Peak. Chase Millennials, move-up buyers and Boomers
Slide63What About Things Here?
Slide64Things Are Good Everywhere
Slide65The Future Looks a Bit Better Than the Present
Slide66Richmond, Va. Beach & the State of VirginiaRichmond performs best, Virginia Beach is weakest.
Slide67State Unemployment RatesOnly three states have rates that are meaningfully above 5%
Slide68Economic Conditions in the Richmond, VA MSAPeaked in October 2015, have been weaker since. Norfolk is weakest. DC > Richmond
Slide69Employment level in the Richmond, VA MSAGrowth keeps rising but the last two years have shown a slowdown in fall
Slide70Labor Force Growth and Payroll Growth is GoodWhen Red is above Blue the unemployment rate falls. Since 2016, both have been equal
Slide71Unemployment Rate in RichmondHas not really fallen since early 2016, due to a rise in the labor force
Slide72Employment levels in top 5 industries in Richmond, VA Four of the top five are growing; but not #1! And education & health are the future!
Slide73Employment level in next 5 industries in Richmond, VAAll but Information are flat or growing. Manufacturing leveled off after the recession.
Slide74Housing Prices In RichmondWithin 1% of all-time high. Nice solid recovery
Slide75Housing Starts in Richmond Single-family very slowly rises, multifamily is OK.
Slide76Elliot F. Eisenberg, Ph.D.
Cell
: 202.306.2731
elliot@graphsandlaughs.net
www.econ70.com
Do you want to get my daily 70 word economics email?
Please give me your business card or text “bowtie” to 22828
Thank
YOU
all
very
very
much!
@ECON70
ANY QUESTIONS?