/
DEPENDENCE OF THE MGA CODE PERFORMANCE ON DETECTOR ENERGY RESOLUTION C DEPENDENCE OF THE MGA CODE PERFORMANCE ON DETECTOR ENERGY RESOLUTION C

DEPENDENCE OF THE MGA CODE PERFORMANCE ON DETECTOR ENERGY RESOLUTION C - PDF document

dandy
dandy . @dandy
Follow
347 views
Uploaded On 2021-09-13

DEPENDENCE OF THE MGA CODE PERFORMANCE ON DETECTOR ENERGY RESOLUTION C - PPT Presentation

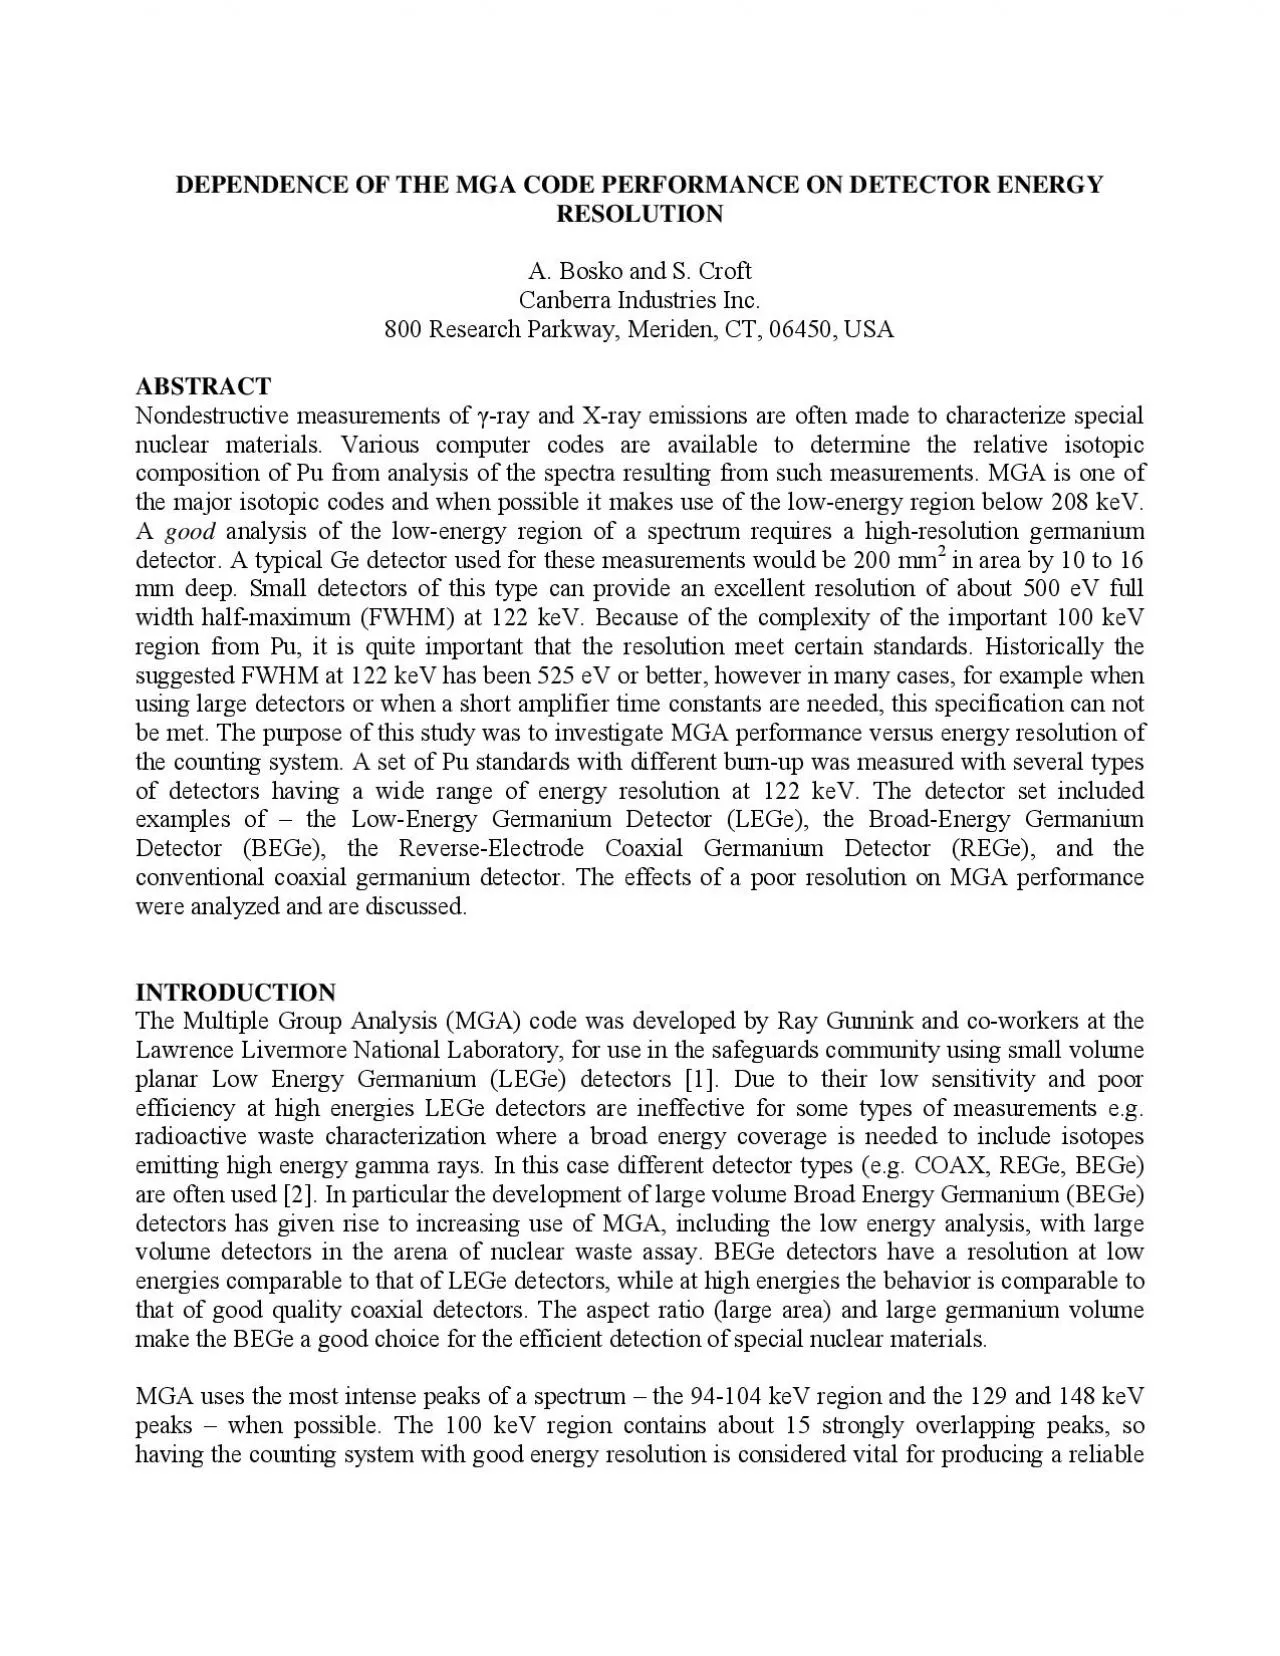
results during isotopic analysis Traditionally it was recodetector with a full width halfmaximum FWHMHowever in many cases when using large detectors or when using a short amplifier time constant thi ID: 879780

detector bege resolution coax bege detector coax resolution weight kev rege lege sample results plutonium 122 isotopic counting measured

Share:

Link:

Embed:

Download Presentation from below link

Download Pdf The PPT/PDF document "DEPENDENCE OF THE MGA CODE PERFORMANCE O..." is the property of its rightful owner. Permission is granted to download and print the materials on this web site for personal, non-commercial use only, and to display it on your personal computer provided you do not modify the materials and that you retain all copyright notices contained in the materials. By downloading content from our website, you accept the terms of this agreement.


Presentation Transcript

1 DEPENDENCE OF THE MGA CODE PERFORMANCE O
DEPENDENCE OF THE MGA CODE PERFORMANCE ON DETECTOR ENERGY RESOLUTION Canberra Industries Inc. 800 Research Parkway, Meriden, CT, 06450, USA ABSTRACT Nondestructive measurements of -ray and X-ray emissions are often results during isotopic analysis. Traditionally it was recodetector with a full width half-maximum (FWHM)However in many cases when using large detectors or when using a short amplifier time constant this ideal can not be met. The purpose of this work was to experimentally examine to what extent the detector resolution impacts the results generated by MGA. EXPERIMENTAL SETUP Ten different detectors were used in this study, each having a different energy resolution. A summary of the detector information can be fowas measured using different counting conditions and geometries. Each standard of plutonium sulfate tetrahydrate, contained in a glass microbottle crobottle isotopic composition of the standards is given in Table 2. The 241Am weight fraction is not certified but has been estimated from the app

2 roximate date of chemical separation [4]
roximate date of chemical separation [4]. Detector Type Detector ID Detector Model Resolution at 122 keV, eV BEGe BEGe - 1 BE3825 583 BEGe BEGe - 2 BE3830 576 BEGe BEGe - 3 BE5030 579 GL0510P GL0110R GC4020 GC4020 GC2020 GR4520 GR1318 Table 2 Isotopic composition of the plutonium samples (Am is quoted relativWeight percent of Pu and Am-241 as of February 28, 2007 Am-241 0.193 12.498 0.754 0.592 3.584 CRM136 0.232 19.027 0.861 1.243 3.848 CRM137 0.0086 7.955 0.090 0.0335 0.557 CRM138 Each sample was measured five times, and each time a spectrum was acquired under certain the sample-to-detector distance varied for different samples, so that the dead-time was the counting time varied between 140 – 600 sethe measured sample in order to acquire about 60,000 counts in the 100 keV region for each spectrum all the measurements described here were performed using detectors covered with 2 mm ppress the 60 keV radiation from DATA ANALYSIS yses presented here. All spectra for each of them are presen

3 ted on Figure 1 and Figure 2. We have ch
ted on Figure 1 and Figure 2. We have chosen to consider the of merit for waste applications. This is because the fissile mass often used as a fiducial line from which other nuclides are derived by correlation and is also important for 240coincidence counting measurements. 500600700800900100011001200Resolution at 122 keV, eV239Pu, weight% BEGe-3 LEGe-2 LEGe-1 BEGe-2 REGe-2 COAX-3 COAX-2 COAX-1 BEGe-1 REGe-1 239Pu weight fractions as a function of FWHMobtained for different sampscale is linear so that the relative tightness of the clusters can be readily appreciated. It may be noted that the resultFWHM of the counting system increased. When the FWHM at 122 keV exceeded approximately 500600700800900100011001200Resolution at 122 keV, eV240, weight% BEGe-3 LEGe-2 LEGe-1 BEGe-2 REGe-2 COAX-3 COAX-2 COAX-1 BEGe-1 REGe-1 240eff weight fractions vs FWHMent declared values, blue dotted boxes group the results obtained for different samples. MGA performed least well when analyzing spectrsamples. Examples of nnot be reli

4 ably resolved from Am gamma lines. COAX
ably resolved from Am gamma lines. COAX 500600700800900100011001200Resolution at 122 keV, eVPu, weight% BEGe-3 LEGe-2 LEGe-1 BEGe-2 REGe-2 COAX-3 COAX-2 COAX-1 BEGe-1 REGe-1 239Pu weight fractions measured by each detector plotted against resolution. The error bars represent an average of the uncertainty reported by the code for each sample. 239eff As it is shown on these plots, while all the spectra had approximately the same counting statistics the reported uncertainty for the results grows as the resolution of the system decreases. The reported tector and the low-burn-up sample, and up to about 2.4% for the coaxial detector measuring the high burn-up sample. The differences from the ed measurement uncertainties, so there was no particular evidence for bias. 500600700800900100011001200Resolution at 122 keV, eVeff, weight% BEGe-3 LEGe-2 LEGe-1 BEGe-2 REGe-2 COAX-3 COAX-2 COAX-1 BEGe-1 REGe-1 240 weight fractions measured by each detector (error bars represent an average uncertainty reported for each sample).

5 CONCLUSIONS Three plutonium samples
CONCLUSIONS Three plutonium samples of different levels of detector energy resolution. The plutonium items were 514 eV to 1194 eV at 122 keV. Although the recommended value for energy resolution is lessdifference found in the results for systems with resolution up to about 600 eV. This work also showed systems with resolution ofalthough the measurement uncertainties may strongly depend on sample isotopic composition. The better results, judged against known values, are usually achieved for low burn-up samples. Experimental measurements also showed that MGA version 9.63H starts failing to produce results eV. These occurrences would usually be subjected to subject matter expert review. Additional work remains to be done to cover the missing lution from 600 eV to 900 eV. Our study was also limited to only three compositions. We note that for waste applications the measurement objectives may be less stringent than is the case for classical safeguarding of bulk materials and the creation of balance accounts. This i

6 s was the primary driver for invesimpres
s was the primary driver for invesimpressed by how robust MGA version 9.63H performed outside of the original detector envelope envisioned by the designers. We notand that these results need to refinement of such versions. REFERENCES R. Gunnink, " A New One-Detector Analysis Method for Rapid High-Precision Plutonium Isotopic Measurements", Proceedings of the 9th ESARDA Symposium on Safeguards and Nuclear Management, London, UK, 12-14 May 1987: 167-171. M. Koskelo, C. G. Wilkins, J. G. Fleissner, “Comparison of the performance of different Plutonium Isotopic Codes using a Range of Detector Types”, Proceedings of the 23rd ESARDA Symposium on Safeguards and Nuclear Management, Bruges, Belgium, 8-10 May 2001: 657-665. R. Venkataraman and S. Croft, “Determination of plutonium mass using gamma-ray spectrometry”, Nucl. Inst. and Meth. A505 (2003) 527-530. R. Venkataraman and S. Croft, “Determination of plutonium mass using gamma ray spectrometry”, Canberra Industries Internal Report, April 20