/
Appalachian Compact  LLRW Disposal Data Appalachian Compact  LLRW Disposal Data

Appalachian Compact LLRW Disposal Data - PowerPoint Presentation

daniella
daniella . @daniella
Follow
27 views
Uploaded On 2024-02-02

Appalachian Compact LLRW Disposal Data - PPT Presentation

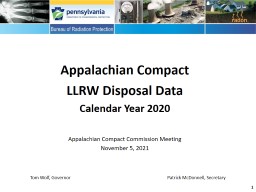
Calendar Year 2020 Appalachian Compact Commission Meeting November 5 2021 Tom Wolf Governor Patrick McDonnell Secretary ID: 1043505

llrw compact 2020 waste compact llrw waste 2020 disposed activity appalachian tenorm disposal volume clive utah energysolutions include type

Share:

Link:

Embed:

Download Presentation from below link

Download Presentation The PPT/PDF document "Appalachian Compact LLRW Disposal Data" is the property of its rightful owner. Permission is granted to download and print the materials on this web site for personal, non-commercial use only, and to display it on your personal computer provided you do not modify the materials and that you retain all copyright notices contained in the materials. By downloading content from our website, you accept the terms of this agreement.


Presentation Transcript

1. Appalachian Compact LLRW Disposal DataCalendar Year 2020Appalachian Compact Commission MeetingNovember 5, 2021Tom Wolf, Governor Patrick McDonnell, Secretary1

2. Volume is in cubic feet. This data is for LLRW disposal at EnergySolutions in Clive, Utah, and Waste Control Specialists in Andrews, Texas, for the calendar year 2020. It does not include TENORM waste volumes for PA or WV. Appalachian Compact Disposed LLRW Volume by State and Facility Type - 2020 2Facility Type/StateWV DEMDPATotalAcademic223112459Government0010012,78312,883Industry0012,02891,914103,942Medical0 064064Utility0 03,50625,09128,597Total22315,709129,811145,545

3. Appalachian Compact Disposed LLRW Volume by State and Facility Type - 2020 3

4. Activity is in curies. This data is for LLRW disposal at EnergySolutions in Clive, Utah, and Waste Control Specialists in Andrews, Texas, for the calendar year 2020. This table does not include curie activity from TENORM waste.Appalachian Compact Disposed LLRW Activity by State and Facility Type - 2020 Facility Type/StateWVDEMDPATotalAcademic<0.1<0.1<0.1<0.1<0.1Government00<0.10<0.1Industry001.0219220Medical000.300.3Utility000.2993993Total<0.1<0.11.51,2121,2134

5. Appalachian Compact Disposed LLRW Activity by State and Facility Type - 2020 5

6. Appalachian Compact Disposed LLRW Volume in Cubic Feet from 2000 to 2020YearWVDEMDPATotal200053289,767421,398431,2462001447610,760534,429545,31020021833666,75355,37162,6742003152743,70374,90178,8292004354913,17855,13668,3972005274107,95691,293199,3262006385948,13257,628105,8572007494321,01678,45599,56220081324156,703113,483120,7332009*13443121,451103,667125,6842010*112922,95876,51999,5182011*191,06110,569155,509167,1572012*217512,364122,380134,8412013*4534023,59772,06796,0482014**254372,33456,040128,4422015**194518,20391,223109,4902016**257,351199,292206,6492017**1346,588377,234383,8572018**1705,498272,620278,1352019**02617,193194,052211,2712020**22315,709129,811145,545Total 20001,0043,275461,7823,332,508Grand Totalto 2020    3,798,570* 2009 to 2013 LLRW volume only includes disposal at EnergySolutions in Clive, Utah. ** 2014 to 2020 includes disposal at EnergySolutions in Clive, Utah, and Waste Control Specialists in Andrews, Texas. Years 1999 to 2008 include disposal at Barnwell, South Carolina, and Energy Solutions, Clive, Utah. Past LLRW Annual Reports, years 2016 to 2020, do not include TENORM waste volumes. 6

7. Appalachian Compact Disposed LLRW Volume in Cubic Feet from 2000 to 20207

8. Appalachian Compact Disposed LLRW Activity in Curies from 2000 to 2020* 2009 to 2013 LLRW activity only includes disposal at EnergySolutions in Clive, Utah. ** 2014 to 2020 includes disposal at EnergySolutions in Clive, Utah, and Waste Control Specialists in Andrews, Texas. Years 1999 to 2008 include disposal at Barnwell, South Carolina, and EnergySolutions, Clive, Utah. Past LLRW Annual Reports, years 2016 to 2020, do not include TENORM waste volumes. YearWVDEMDPATotal20002.2<0.1484357,624358,1112001<0.1<0.1903.3168,920169,82320020.10.5244.56,7777,02320030.224.7166.3241,650241,84120040.80.211,83118,89030,72220050.731.3156.858,78658,9752006<0.111.960.191,71991,79120070.212.925,305492,579517,89720080.112.22,182283,329285,5232009*<0.10.54.71,0011,0072010*<0.1<0.11.46566582011*<0.111.84934962012*<0.1<0.12.14494512013*<0.145.315.74595202014**<0.1<0.1260.71,2131,4742015**<0.1<0.127.84,1474,1752016**0.4<0.12092,0202,2292017**<0.1<0.1178.51,7111,8902018**<0.10125.342,02742,1532019**0<0.172.68349072020**<0.1<0.11.51,2121,213Total 20004.8140.642,233.11,776,498Grand Totalto 2020    1,818,8768

9. Appalachian Compact Disposed LLRW Activity in Curies from 2000 to 20209

10. Appalachian Compact Disposed LLRW Activity in Curies from 2011 to 202010

11. Appalachian Compact Percent Disposed LLRW Volume by Disposal Site - 2020 11EnergySolutions

12. Appalachian Compact Percent Disposed LLRW Activity by Disposal Site - 2020 12EnergySolutions

13. Disposed Compact LLRW and TENORM 2016 - 2020 TENORMLLRWYearsVolume(ft3)Activity(Ci)Volume(ft3)Activity(Ci)2016384000.9123206649222920171120322.7338385618902018660481.882781364215320191080962.8621127190720202503443.501455451213Total574,92012.01,225,45748,39213This table separates waste that is considered TENORM and compares the values to the rest of the waste generated within the Compact. It compares both volume and activity.

14. Disposed Compact LLRW and TENORM by Volume 2016 - 2020 14* Waste data is given with TENORM waste that was included in the Compact. This chart separates waste that is considered TENORM and compares the values to the rest of the waste generated within the Compact.

15. Disposed Compact LLRW and TENORM by Activity 2016 - 2020 15* Waste data is given with TENORM waste that was included in the Compact. This chart separates waste that is considered TENORM and compares the values to the rest of the waste generated within the Compact.

16. 16Rich JanatiBureau of Radiation ProtectionPhone: 717-787-2163rjanati@pa.govThank you.Questions?