PDF-Vol 1 No1 2005 003017 Rinton PressMUVA A FLEXIBLE VISUALIZATION ARC
Author : daniella | Published Date : 2021-09-09
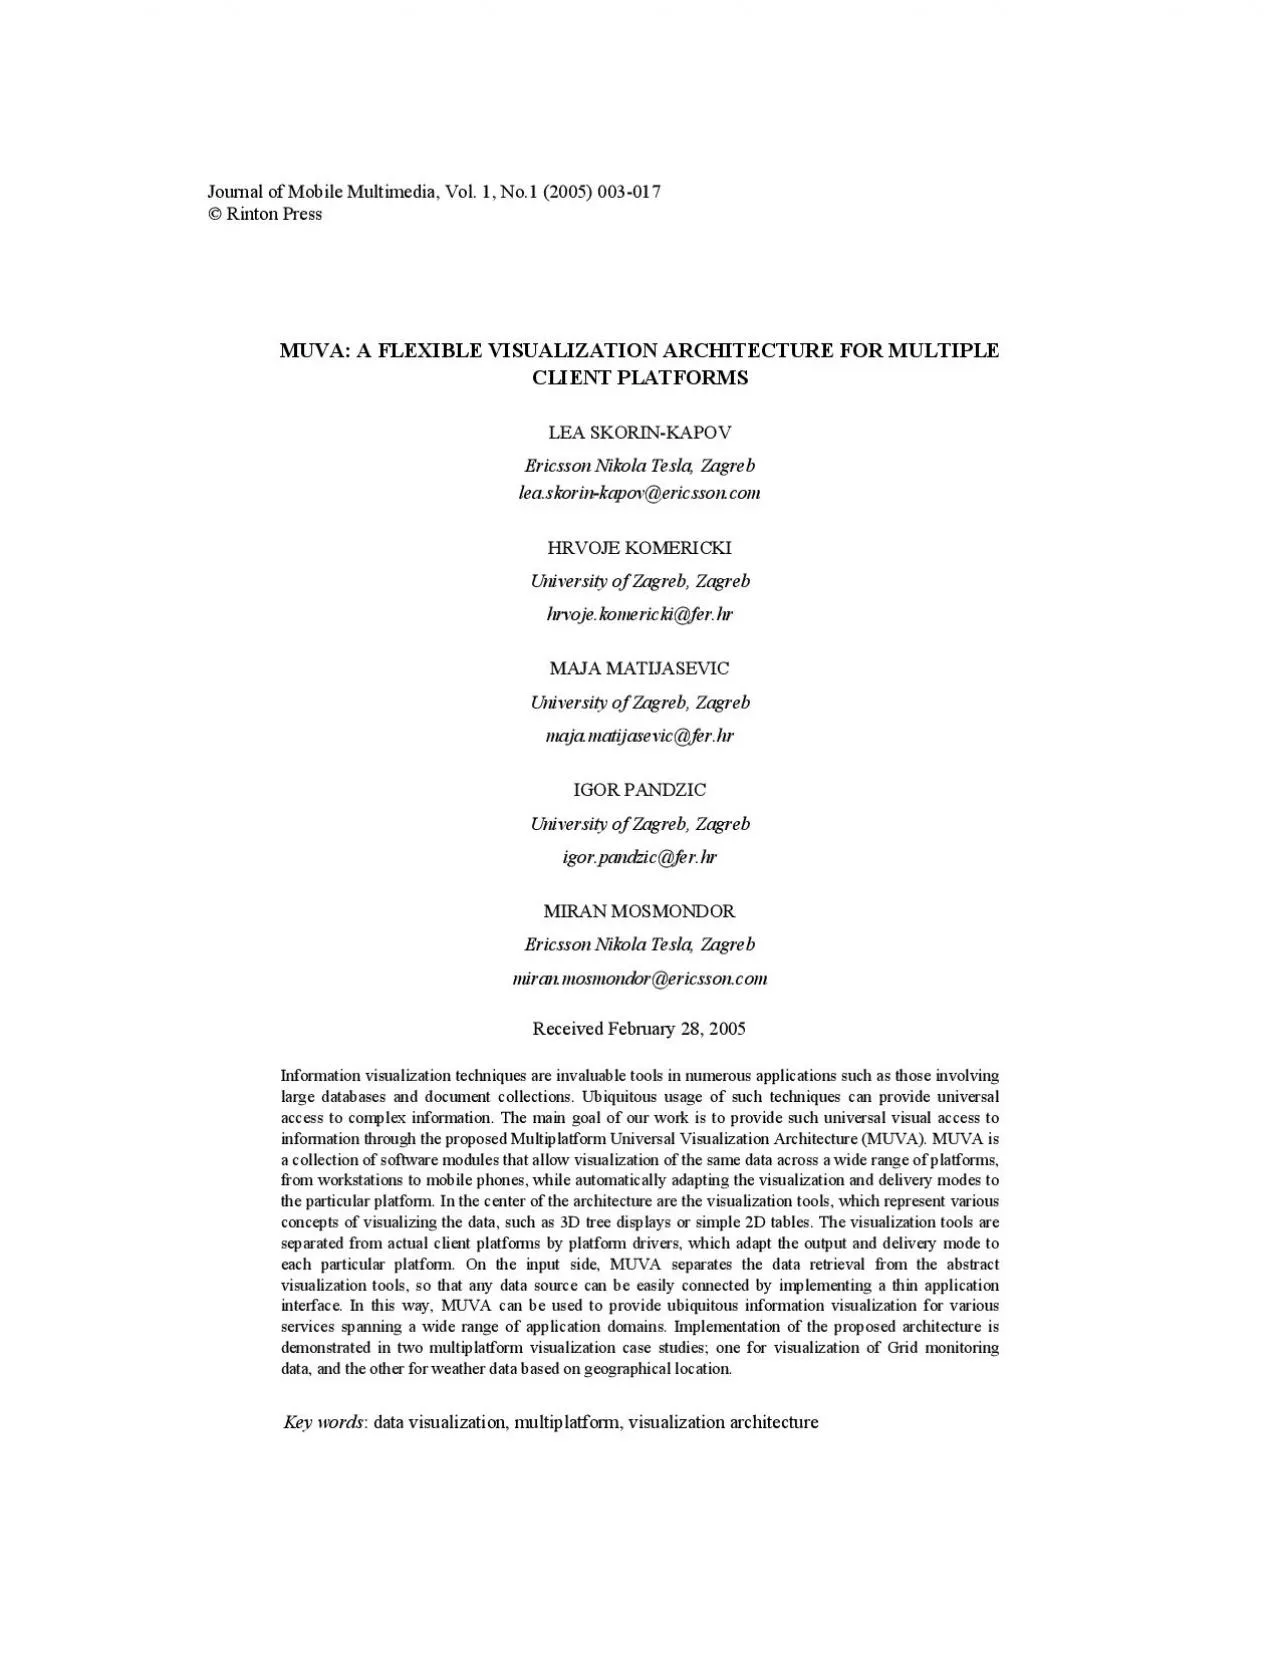
4 MUVA a Flexible Visualization Architecture for Multiple Client Platforms1 Introduction Information visualization is a growing area of interest and research As
Presentation Embed Code
Download Presentation
Download Presentation The PPT/PDF document "Vol 1 No1 2005 003017 Rinton PressMUVA ..." is the property of its rightful owner. Permission is granted to download and print the materials on this website for personal, non-commercial use only, and to display it on your personal computer provided you do not modify the materials and that you retain all copyright notices contained in the materials. By downloading content from our website, you accept the terms of this agreement.
Vol 1 No1 2005 003017 Rinton PressMUVA A FLEXIBLE VISUALIZATION ARC: Transcript
Download Rules Of Document
"Vol 1 No1 2005 003017 Rinton PressMUVA A FLEXIBLE VISUALIZATION ARC"The content belongs to its owner. You may download and print it for personal use, without modification, and keep all copyright notices. By downloading, you agree to these terms.
Related Documents