/
1 IR-Spectroscopy IR region 1 IR-Spectroscopy IR region

1 IR-Spectroscopy IR region - PowerPoint Presentation

danika-pritchard
danika-pritchard . @danika-pritchard
Follow
373 views
Uploaded On 2020-01-23

1 IR-Spectroscopy IR region - PPT Presentation

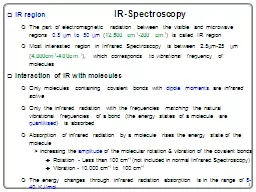
1 IRSpectroscopy IR region The part of electromagnetic radiation between the visible and microwave regions 08 m to 50 m 12500 cm 1 200 cm 1 is called IR region Most interested region in Infrared Spectroscopy is between 25 ID: 773581

bond spectroscopy infrared absorptions spectroscopy bond absorptions infrared region spectrum bonds absorption molecule compounds frequencies 3000 vibration 1500 atoms

Share:

Link:

Embed:

Download Presentation from below link

Download Presentation The PPT/PDF document "1 IR-Spectroscopy IR region" is the property of its rightful owner. Permission is granted to download and print the materials on this web site for personal, non-commercial use only, and to display it on your personal computer provided you do not modify the materials and that you retain all copyright notices contained in the materials. By downloading content from our website, you accept the terms of this agreement.


Presentation Transcript

1 IR-Spectroscopy IR region The part of electromagnetic radiation between the visible and microwave regions 0.8  m to 50  m ( 12,500 cm -1 - 200 cm -1 ) is called IR region Most interested region in Infrared Spectroscopy is between 2.5  m-25  m ( 4,000cm -1 - 400cm -1 ), which corresponds to vibrational frequency of molecules Interaction of IR with molecules Only molecules containing covalent bonds with dipole moments are infrared active Only the infrared radiation with the frequencies matching the natural vibrational frequencies of a bond (the energy states of a molecule are quantitised ) is absorbed Absorption of infrared radiation by a molecule rises the energy state of the molecule increasing the amplitude of the molecular rotation & vibration of the covalent bonds Rotation - Less than 100 cm -1 (not included in normal Infrared Spectroscopy) Vibration - 10,000 cm -1 to 100 cm -1 The energy changes through infrared radiation absorption is in the range of 8-40 KJ/ mol

IR-SpectroscopyAtoms in a molecule are constantly in motionThere are two main vibrational modes:Stretching - (symmetrical/asymmetrical) change in bond length - high frequencyBending - (scissoring/stretch/rocking/twisting) change in bond angle - low freq.The rotation and vibration of bonds occur in specific frequencies Every type of bond has a natural frequency of vibration, depending onthe mass of bonded atoms (lighter atoms vibrate at higher frequencies) the stiffness of bond (stiffer bonds vibrate at higher frequencies)the force constant of bond (electronegativity) the geometry of atoms in molecule The same bond in different compounds has a slightly different vibration frequ.Functional groups have characteristic stretching frequencies. Spectroscopy Application

Infrared SpectroscopyCharacteristics of an IR Spectrum In an IR spectrometer, light passes through a sample. Frequencies that match the vibrational frequencies are absorbed, and the remaining light is transmitted to a detector. An IR spectrum is a plot of the amount of transmitted light versus its wavenumber . Frequencies in IR spectroscopy are reported using a unit called wavenumber (  ):Wavenumber is inversely proportional to wavelength and is reported in reciprocal centimeters (cm–1). Let us now consider the IR spectrum of 1-propanol, CH3CH2CH2OH.  = 1/ ~

4Infrared Spectroscopy Characteristics of an IR Spectrum—1-Propanol

5 Infrared Spectroscopy Characteristics of an Infrared Spectrum The IR spectrum is divided into two regions: the functional group region (at  1500 cm -1 ), and the fingerprint region (at < 1500 cm -1 ). Figure 13.8Comparing the functional groupregion and fingerprint region oftwo compounds

Infrared SpectroscopyCharacteristics of an Infrared Spectrum The y -axis is % transmittance : 100% transmittance means that all the light shone on a sample is transmitted and none is absorbed. 0% transmittance means that none of the light shone on the sample is transmitted and all is absorbed. Each peak corresponds to a particular kind of bond, and each bond type (such as O—H and C—H) occurs at a characteristic frequency. Wavenumber, frequency and energy decrease from left to right. Where a peak occurs is reported in reciprocal centimeters (cm-1).

7 Infrared Spectroscopy IR Absorptions Bonds absorb in four predictable regions of an IR spectrum. Figure 13.10 Summary: The four regions of the IR spectrum

8 IR Spectrum Region freq. (cm -1 ) what is found there?? XH region 3800 - 2600 OH, NH, CH ( sp , sp 2, sp3) stretchestriple bond 2400 - 2000 CºC, CºN, C=C=C stretchesdouble bond 1900 - 1500 C=O, C=N, C=C stretchesfingerprint 1500 - 400 many types of absorptions 1400 - 900 C-O, C-N stretches 1500 - 1300 CH in-plane bends, NH bends 1000 - 650 CH out-of-plane (oop) bends Spectroscopy Application Principal Correlation Chart O  H 3600 cm -1 N  H 3500 cm -1 C  H 3000 cm -1 C N 2250 cm -1 C C 2150 cm -1 C=O 1715 cm -1 C=C 1650 cm -1 CO 1100 cm-1 Dispersive (Double Beam) IR Spectrophotometer Prism or Diffraction Grating Slit Photometer IR Source Recorder Split Beam Air Lenz Sample

9Infrared Spectroscopy IR Absorptions

Infrared SpectroscopyIR Absorptions Even subtle differences that affect bond strength affect the frequency of an IR absorption. The higher the percent s -character, the stronger the bond and the higher the wavenumber of absorption.

Infrared SpectroscopyIR Absorptions For a bond to absorb in the IR, there must be a change in dipole moment during the vibration. Symmetrical nonpolar bonds do not absorb in the IR. This type of vibration is said to be IR inactive.

12Infrared Spectroscopy IR Absorptions in Hydrocarbons Hexane has only C-C single bonds and sp 3 hybridized C atoms. Therefore it has only one major absorption at 3000-2850 cm -1 .

13Infrared Spectroscopy IR Absorptions in Hydrocarbons 1-Hexene has a C=C and C sp 2 -H, in addition to sp 3 hybridized C atoms. Therefore, there are three major absorptions: Csp2-H at 3150-3000 cm-1; Csp3-H at 3000-2850 cm-1; C=C at 1650 cm-1.

14Infrared Spectroscopy IR Absorptions in Hydrocarbons 1-Hexyne has a C  C and C sp -H, in addition to sp 3 hybridized C atoms. Therefore, there are three major absorptions: Csp-H at 3300 cm-1; Csp3-H at 3000-2850 cm-1; CC at 2250 cm-1.

15Infrared Spectroscopy IR Absorptions in Oxygen Containing Compounds The OH group of the alcohol shows a strong absorption at 3600-3200 cm -1 . The peak at ~3000 cm -1 is due to sp 3 hybridized C—H bonds.

16 Infrared Spectroscopy IR Absorptions in Oxygen Containing Compounds The C=O group in the ketone shows a strong absorption at ~1700 cm -1 . The peak at ~3000 cm -1 is due to sp3 hybridized C—H bonds.

17Infrared Spectroscopy IR Absorptions in Oxygen Containing Compounds The ether has neither an OH or a C=O, so its only absorption above 1500 cm -1 occurs at ~3000 cm -1 , due to sp 3 hybridized C—H bonds.

18Infrared Spectroscopy IR Absorptions in Nitrogen Containing Compounds The N—H bonds in the amine give rise to two weak absorptions at 3300 and 3400 cm -1 .

19Infrared Spectroscopy IR Absorptions in Nitrogen Containing Compounds The amide exhibits absorptions above 1500 cm -1 for both its N—H and C=O groups: N—H (two peaks) at 3200 and 3400 cm -1 ; C=O at 1660 cm -1 .

20Infrared Spectroscopy IR Absorptions in Nitrogen Containing Compounds The C N of the nitrile absorbs in the triple bond region at ~2250 cm -1 .

21Infrared Spectroscopy Worked exampleThe infrared spectrum below is for one of the molecules shown. Identify the molecule and explain how you arrived at your choice.

22Interpretation of the spectra Looking in the region above 1500 cm − 1 , we can identify a band in the region 2840–3100 cm−1 that is due to a C–H bond and an absorption in the region 1700–1750 cm −1 that is due to the C=O bond. This eliminates molecules A and B, as neither of these contains a C=O bond. C is a carboxylic acid, which would be expected to have a very broad O–H band in the region 2400–3400 cm−1. This band is not present in the spectrum, so the spectrum cannot be for molecule C. This means that we are left with molecule D. Molecule D contains C–H and C=O bonds and should also give rise to a band in the region 1000–1300 cm−1 as it contains a C–O bond; we can see from the spectrum that there is a band in this region.

23 IR-Spectroscopy Use of Infra-Red spectroscopy IR spectroscopy can be used to distinguish one compound from another. No two molecules of different structure will have exactly the same natural frequency of vibration, each will have a unique infrared absorption spectrum. A fingerprinting type of IR spectral library can be established to distinguish a compounds or to detect the presence of certain functional groups in a molecule.Obtaining structural information about a molecule Absorption of IR energy by organic compounds will occur in a manner characteristic of the types of bonds and atoms in the functional groups present in the compoundPractically, examining each region (wave number) of the IR spectrum allows one identifying the functional groups that are present and assignment of structure when combined with molecular formula information.The known structure information is summarized in the Correlation Chart Spectroscopy Application