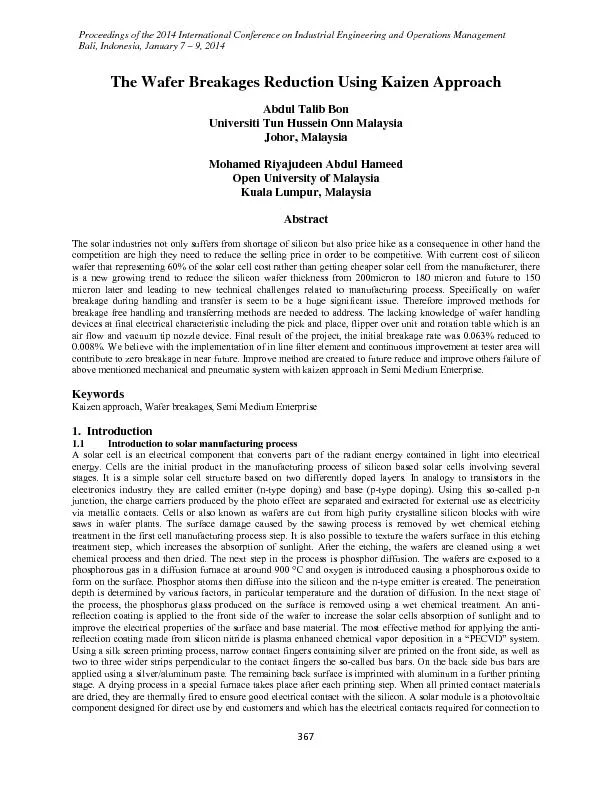
/
an entire solar system. In solar modules based on crystalline solar ce an entire solar system. In solar modules based on crystalline solar ce

an entire solar system. In solar modules based on crystalline solar ce - PDF document

danika-pritchard
danika-pritchard . @danika-pritchard
Follow
537 views
Uploaded On 2016-10-20

an entire solar system. In solar modules based on crystalline solar ce - PPT Presentation

Figure 1 Large breakages Figure 2 Small Breakages They are many reasons that causing the breakage such us incoming material itself handling issue tools malfunction and others related factors ID: 478627

Figure Large breakages

Share:

Link:

Embed:

Download Presentation from below link

Download Pdf The PPT/PDF document "an entire solar system. In solar modules..." is the property of its rightful owner. Permission is granted to download and print the materials on this web site for personal, non-commercial use only, and to display it on your personal computer provided you do not modify the materials and that you retain all copyright notices contained in the materials. By downloading content from our website, you accept the terms of this agreement.


Presentation Transcript

an entire solar system. In solar modules based on crystalline solar cells, the individual solar cells are electrically connected in series using contact ribbons. The matrix of solar cells is laminated between a glass panel and several foils of plastic materials at sub-atmospheric pressure and at an elevated temperature to make it weather-resistant. The solar modules are then fitted with a frame and a junction box, and are then ready for installation on rooftops or in solar power stations. 1.2 Problem statement To date solar cell technology offers a leading edge level of efficiency in mass production. Thanks to it highly efficient processes, As we know that silicon is initially crystallized to ingots a silicon blocks or columns of silicon which are later cut into wafers using a wire saw with suspension and then cleaned. Practically the cell thickness are in range of 180~200 micron. Manufacturer had produce thinner wafer due to hike on silicone price. But the major drawback when the thickness reduces it contributes to high breakages. A broken wafer is a loss and an opportunity. When a wafer breaks figure 1 and figure 2 during processing the first impulse is to clean up the mess and trash the broken pieces and not to forget the hazarded of it share edges. Broken wafer can be sold in much lower price to industries that applied solar power device on this product such watch and calculator manufacturer. Any how it does not compensate the initial buying price. But today with high competition from other major player the product price are reduce but the base material price are increasing due to demand not only from solar industries bur also electronic industries that used it as based for integrated circuit. Figure 1: Large breakages Figure 2: Small Breakages They are many reasons that causing the breakage such us incoming material itself, handling issue, tools malfunction and others related factors. When we observe the fracture markings on the broken edges actually represent a detailed recording of the rapid sequence of events that took place during the breakage event. By examining the fracture markings with a microscope, it is often possible to discover how and why the wafer broke so that appropriate corrective and preventive actions can be taken.A wafer begins to break apart when the silicon at some surface location is subjected to a sufficiently large tensile stress. The tensile stress can arise due to wafer bending, uneven cooling, penetration, or during an impact when the silicon is compressed in one direction but pulled apart in other directions. The stress required to break a wafer is greatly reduced if the wafer surface has a stress concentrator such as a preexisting crack. We need to analysis and discover how and why a wafer broke so that future occurrence can be prevented. If a wafer broke because of a weakness such as a scratch that occurred at a prior processing step then that weakness can be eliminated. If a wafer broke because it was bent or penetrated by a piece of wafer handling equipment, then that equipment can be adjusted. A broken wafer is not only a loss but an opportunity for improvement. That is the reason why this project are been selected. After collecting the required data a rough guide had been implemented in order to reduce breakages level before any improvement activities taken, as per following table. This would help personnel from maintenance, quality and operation to adhere to standard of performing task to reduce the number of breakages. 2. Literature Review The wafers are one of the main assets in solar cells production. Crystalline silicon (Si) has taken a dominant role in contributing to over 90% of the entire solar power module production. It is important to recognize that the silicon wafer is a large contributor, up to 75%, to the overall cost of the solar cell. The wafers will gradually be thinner to reduce material costs. To contribute in cost reduction and compensate for the feedstock shortage, solar wafers are sliced thinner with thicknesses down to 150 microns due to this the as such company rules stated that every employee is required to handle the wafers with care and avoid the breakage of cells and wafers. In even of breakages we need classify it accordingly this because of wafer recycling activity. In order to help operator segregated the breakages accordingly below method used, by using the breakage wafer/cell reference format, we can define the size of breakage wafer or breakage cell. Although the concept of applying fracture physics, through single particle breakage, to comminution processes was pioneered by Rumpf beginning in the 1960’s, the first single particle tests where conducted in the 1930’s (Carey and Bosanquet, 1933). The purpose of these tests was to determine the energy necessary to reduce coal and gypsum particles (ranging from 2 to 50 mm) to a certain size The breakage wafer or breakage cell is measured by referring it physically to the reference format. For example, if the breakage wafer can fully cover the 125mm x 125 mm box, it will be defined as large breakage. Table 1: Possible Prevention Area Related Process Description Loading and unloading Avoid unnecessary loading and unloading of wafer carriers. If required, request additional carriers for temporary If cells are loaded or unloaded by hand to/from carriers, this shall be executed only outside of the system. If cells/wafers are unloaded, the Styrofoam boxes must be used as buffers. The maximum capacity is100 cells. No pile up carriers loaded with cells/wafers. Used the fixture during loading/unloading. The carriers must place on proper place such as rack and trolley Transportation Place and transport loaded carriers and Styrofoam boxes only on pneumatic carriages with rubber mats Do not pile up carriers loaded with cells/wafers. Carry the magazines/carriers in proper ways Automation The automation must be permanently monitored, to detect breakage and deviations as quickly as possible. Each deviation must be remedied If heavy breakage occurs, stop the system and inform respective team. 50mm 125mm 155mm Figure 3: Breakage size classification Above criteria are purely for those handling breakage during data collection. During real-time production, we need a feedback system from the tool user to the tool owner in event of breakage is out of tolerance. The breakage triggering rate/limit had been created it is six pieces at tester area per hours and this is limits to stop and rectify the tools by the respective owner. If the breakage rate hits the triggering limit by hour, dedicated action plan should created and implement in order to contain the breakage rate from going higher. During the project we managed to build a breakages data catalogue this for faster breakage root cause finding and recognition in respective process areas. The dimensions of defect are in all shape and sizes. 2.1 Breakages Catalogue Figure 4: Loading area Loading area – where throughput loss because of improper handling during loading. Ensure that unpacking is done at clean no splinters and other contaminants and padded work station with special underlay cardboard. With possible breakages at every edge as prefigure above. Figure 5: belt magazine the abrasion caused by the belt magazine at the wafer loader Since wafer been transport through carrier called belt magazine the abrasion caused by the belt magazine at the wafer loader will cause following breakages as per fig 5. Operator need to check the belt magazine rollers and air nozzles for any abnormality. This also possible to occur when splinters trapped on the conveyor rollers of the tester and the concentricity of the rollers is out. Operator must removes the splinters trapped on the rollers and ensure that the concentricity of the rollers is not out. Figure 6: splinters in the suction cups of the wafer picker Following is wafer breakage fig: 6 due to splinters in the suction cups of the wafer picker. Operator need to removes the splinters from the wafer picker. Other possible is wafer hitting carrier guide bars. Maintenance personnel need to recalibrate or correct the wafer position when entering the carrier. Wafer must not touch or hit the guide bars. With this breakages catalogue we also manage to map out all the cell contact point with the tools moving part as depict below Figure 7: Cell contact point mapping/ template 3.1 Data Collection Regardless of the field of study or preference for defining data accurate data collection is essential to maintaining the integrity of project. Both the selection of appropriate data collection instruments and clearly delineated instructions for their correct use reduce the likelihood of errors occurring. The first step is gathered the data at the entire tester in event of breakages operator will update record in sheet with references of the location of the incident. These check sheets are actually tester layout diagrams, which show where a particular problem occurs. The spatial location is valuable in identifying root causes and planning corrective action. The diagram makes it easy to identify a problem area that would be difficult to depict otherwise. In this case, a picture is truly worth a thousand words of explanation. The data had been complied for duration of 6 month. The process of gathering and measuring information on variables of interest in an established systematic fashion that enables one to answer questions which tools that contributes to highest breakage. The result had projected as per below table:- Table 2: Data collected from the entire tester for duration of 6 Months Incoming 1868507 1500326 1870460 1611604 2485427 1448778 2288023 1420612 Breakage 438 608 609 526 641 226 620 292 Percentages 0.023% 0.040% 0.033% 0.033% 0.026% 0.016% 0.027% 0.02% Tools Incoming 2190948 2075374 2186208 2039093 978911 0 1460499 0 Breakage 1067 1295 771 1190 571 0 893 0 Percentages 0.048% 0.063% 0.035% 0.058% 0.058% 0 0.061% 0 Chart 1: Pareto of Breakage Quantity by tester from June to December 2011 From the data comparison we can conclude that tester I, J and L are the top three but we should choose tester J due to the highest breakage quantity. In relation to the percentage the result is different H, F and A is the highest. Since we choose the tools based on high number of breakages not the percentages this is mistake during tools selection had been advice by the project supervisor. This will be the guide line for us how effective all the action that will implement to reduce the percentage. By successfully implementing the desirable project at the problematic tools it would guide us on further improve other stabilize tools. We unable to eliminate the breakage to zero because there is other minor factor that not been identify or missed out during the data collection or during improvement project implementation. 3.2: Target breakage reduction for Tester J We must consider that the important of every data integrity and eliminated of errors in the data collection process, whether they are made intentionally or not. Most, Craddick, Crawford, Redican, Rhodes, Rukenbrod, and Laws (2003) describe ‘quality assurance’ and ‘quality control’ as two approaches that can preserve data integrity and ensure the scientific validity of study results. Based on this, we can draw out the losses per month. Further nine more week data gathering had been carrying out after identify the best selected tools that is tester J, this is in order to set the targeted and achievable ratio of breakages reduction. We conclude that after considering the lowest and highest ratio from the table 4, we are able to reduce 69%. Table 3: 9 week data collection WW WW1 WW2 WW3 WW4 WW5 WW6 WW7 WW8 WW9 No of breakage 86 52 85 162 138 126 75 127 168 Chart 2: Number of breakages for 9 weeks Table 4: Targeted achievable reduction ratio Sources Data period No of days No of breakages Breakages / day Corrective action / breakages (Seconds) Time loss / day (minutes) From Test-J Dec 2011 2012 63 1019 (16.17 ) 17 days 60 17 Chart 3: Distribution of loss and cost per year 3.4 Improvement Area From the data and mapping (appendix 1 & 2) we conclude that area needs to focus and improve are as per following:- The pick and place (PNP) that pick-up the wafer cells in slanted position will affect for early stage of breakage, contribute to 45% of breakage. Ejector spring in the housing stuck & created the impact force during pick up wafer The acceleration of potential energy by drop height will lead to micro crack at flipper section lead to 25% breakage. Wafer release (drop) & misplaced (skew) during rotary movement due to insufficient vacuum (or not all vacuum nozzle is function ) contribute 25% The failure of electro-pneumatic parts will lead to insufficient vacuum level with wrong timing and vacuum lost will cause breakage is 5%. As improvement step had been plan ahead we need to take few precautions methods in order to help minimize the current breakages rate before the, says activity been carry out and result been obtain. Following control parameters give the clear indication area need to be focus it consists of lists of items and some indicator of how often each item on the list occurs. This simplest form of checklists are tools that make the data collection process easier by providing pre written descriptions of events likely to occur. Table 5: Control parameter that had been implemented Cell Tester Process Description Equipment, Jig & Tool Characteristic Specification Measurement Techniques Sample Reaction Plan Process Owner Frequency Loader Wafer separation Ensure among 4 pickers are parallel no stuck Picker is not stuck cause wafer bowing Manual push on picker for verification 3 times Beginning of the shift & replace Loader & Sorter Picker (PNP) Ensure vacuum cup is not wear and tear Vacuum cup is not wear & tear. Visual 1time PM Replaced new vacuum cup MNT Flipper Flipper Ensure there is no broken piece, wafer expose on conveyor No broken piece wafer expose on conveyor Visual 3 times Beginning of the shift Perform OPR Sorting bin Sorting bin Ensure there is no splinter inside sorting bin No broken piece wafer expose on sorting bin Visual 3 times Every shift Perform OPR Following are the identify area need to be improve and below figure is the part need to modify, enhance and fabricated that correlated to above mentioned improvement step and action:- Fail safe clamping mechanism to ensure the 4 PNP pick up moving together Figure 8: Leveling Clamper To protect & increase the lifespan of the electro-pneumatic parts and to maintain the efficiency of signal transfer that control the movement Figure 9: inline filter To reduce the flip over’s drop height to prevent micro crack to wafer Figure 10: Nozzle spacer To maintain the functionality of Ø 5mm spring as an impact absorber for PNP picker Figure 11: M10 housing base The investment involve during that implementation is as per table 4 below: Table 6: Total investment No Item No of parts / module No of Tools Price / Part Total (RM) 1 Leveling clamper 65.00 65.00 2 In-line filter 168.50 337.00 3 Nozzle spacer 10.00 80.00 4 M10 housing base 50.00 200.00 One time investment 782.00 1 Drill bit holder 57.00 57.00 2 HSS Ø1mm drill bit 3.00 3.00 Consumable investment 60.00 Total Investment 842.00 4. Results and Conclusion 4.1 Results The overall result show significant improvement during second wave of data collection as depict below table. During first week of implementation breakages rate is 26pcs. After investigate we had been inform there is new batch of operator been assign at this particular tools. The total number of breakages was mixed up with break due to handling error also been included. Second is the number of volume that supply had reduced from week 16 onward due to the company financial situation and most of the activity had been review on weekly basis. At certain point of time the tester had been idling without any material been load or feed into the system. Even the implementation of in line filter is on hold at the moment. If the incoming volume is homogenous we expected to depict the overall result showing reflect a huge improvement. Another influence factor that we notice is the variations of supplier. On week 16 itself there is change of material supplier this cause of slightly high percentage. Table 7: Breakage after implementation WW WW13 WW14 WW15 WW16 WW17 WW18 WW19 WW20 Incoming 290149 289289 250155 188190 148035 106785 48554 58039 Breakage 26 12 13 17 13 11 8 7 Percentages 0.009% 0.004% 0.005% 0.009% 0.008% 0.010% 0.016% 0.012% End result of the project can view by below table, 8 the initial breakage rate was 0.063% reduce to 0.008%. We believe with the implementation of in line filter element and continuous improvement at tester area will contribute to zero breakage in near future. Another positive point that we notice that the project does not required any FMEA as the project only apply with methods of retro-fit type improvement that is very flexible less tear and wear second there is no direct contact to wafer and lastly no changes in tool parameter, require no calibration or process change. Table 8: Breakage rate comparison at tester J before and after Overall Result Before After Incoming 2075374 1379196 Breakage 1295 106 Percentages 0.063% 0.008% 4.2 Conclusion With a successful outcome of breakage reduction this leads to waste elimination, reduction in operating costs, improved quality in product outputs, and higher customer satisfaction. Productivity and profitability increase when these strategies are applied in tandem by the management for optimizing their potential and reaping full benefits. The successfulness of this project is large depend on the support of the management team without their concern and motivation it is possible to achieve the desirable goals. During implementation we had the opportunities to further improve the plan design and reduce the overall cost modification for example on the leveling clamper unit that had been eliminated due redesign of picker shaft. We hope with improvement it further bring down the company operation cost and make more competitive in the market. Further study on the mechanical stress on wafer should be carryout to eliminate per mature breakage or micro crack on the wafer. We understand that micro cracks will increase the breakage risk over the whole value chain from the wafer to the finished module because the wafer or cell is exposed to stress during handling and processing. The actual need to use larger and thinner crystalline silicon wafers due high cost increases the risk of yield losses. Besides the breakage risk in the production, the cells have to withstand the tensile stresses under outdoor operation in the finished modules. Bassignana, I.C.; Macquistan, D.A. (1993). Crystal quality of III-V substrate wafers and epitaxial layers studied by X-ray topography. Society Symposium Proceedings v 312 Apr 13-15 1993Pittsburgh, PA, USA,Ont. p 185-192 Bodek, Norman (2010). How to do Kaizen: A new path to innovation - Empowering everyone to be a problem . Vancouver, WA, US: PCS Press. ISBN 978-0-9712436-7-5. Craddick, Crawford, Redican, Rhodes, Rukenbrod, and Laws (2003). Dietary quality assurance processes of the DASH-Sodium controlled diet study. Pennington Biomedical Research Center, Baton Rouge European Photovoltaic Industry Association, (2011). Global Market Outlook for Photovoltaics until 2015, EPIA, Brussels, www.epia.org/publications/photovoltaic publications-global-market-outlook/globalmarketoutlook-for- photovoltaics-until-2015.html Hanebuth, D. (2002). Rethinking Kaizen: An empirical approach to the employee perspective. In J. Felfe (Ed.), Organizational Development and Leadership (Vol. 11, pp. 59-85). Frankfurt a. M.: Peter Lang. ISBN 978-3- 631-38624-8. Imai, Masaaki (1997). Gemba Kaizen: A Commonsense, Low-Cost Approach to Management (1e. ed.). McGraw-Hill. ISBN 0-07-031446-2. Scotchmer, Andrew (2008). 5S Kaizen in 90 Minutes. Management Books 2000 Ltd. ISBN 978-1-85252-547-7. Abdul Talib Bon is an Associate Professor in the Faculty of Technology Management and Business at the Universiti Tun Hussein Onn Malaysia. He has a PhD in Computer Science, which he obtained from the Universite de La Rochelle, France in the year 2008. His doctoral thesis was on topic Process Quality Improvement on Beltline Moulding Manufacturing. He studied Business Administration in the Universiti Kebangsaan Malaysia for which he was awarded the MBA in the year 1998. He’s bachelor degree and diploma in Mechanical Engineering which his obtained from the Universiti Teknologi Malaysia. He received his postgraduate certificate in Mechatronics and Robotics from Carlisle, United Kingdom in 1997. He was the Deputy Dean (Research and Development) at the Faculty of Technology Management and Business in the Universiti Tun Hussein Onn Malaysia from 2008 until December 2011. He had published more 100 International Proceedings and International Journals and 5 books. Universiti Tun Hussein Onn Malaysia Open University of Malaysia The solar industries not only suffers from shortage of silicon but also price hike as a consequence in other hand the competition are high they need to reduce the selling price in order to be competitive. With current cost of silicon wafer that representing 60% of the sola is a new growing trend to reduce the silicon wafer thickness from 200micron to 180 micron and future to 150 micron later and leading to new technical challenges related to manufacturing process. Specifically on wafer breakage during handling and transfer is seem to be a huge significant issue. Therefore improved methods for breakage free handling and transferring methods are needed to address. The lacking knowledge of wafer handling devices at final electrical characteristic including the pick and place, flipper over unit and rotation table which is an air flow and vacuum tip nozzle device. Final result of the project, the initial breakage rate was 0.063% reduced to 0.008%. We believe with the implementation of in line filter element and continuous improvement at tester area will contribute to zero breakage in near future. Improve method are created to future reduce and improve others failure of above mentioned mechanical Keywords Kaizen approach, Wafer breakages, Semi Medium Enterprise 1. Introduction 1.1 Introduction to solar manufacturing process A solar cell is an electrical component that converts part of the radiant energy contained in light into electrical energy. Cells are the initial product in the manufacturing process of silicon based solar cells involving several stages. It is a simple solar cell structure based on two differently doped layers. In analogy to transistors in the Proceedings of the 2014 International Conference on Industrial Engineering and Operations Management Bali, Indonesia, January 7 – 9, 2014