/
Delta Air Lines Cost and Productivity Analysis Delta Air Lines Cost and Productivity Analysis

Delta Air Lines Cost and Productivity Analysis - PowerPoint Presentation

danika-pritchard
danika-pritchard . @danika-pritchard
Follow
351 views
Uploaded On 2018-11-22

Delta Air Lines Cost and Productivity Analysis - PPT Presentation

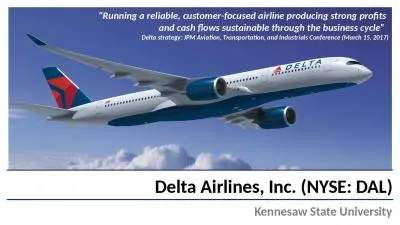
Ujaval Patel Airline Information Delta is considered a legacy carrier It has A heterogeneous fleet mix Fleet hubs Dom ATL DTW MSP LGA SLC JFK CVG MEM Int CDG NRT AMS Small percentage of unionized workers ID: 732867

revenue fuel mile asm fuel revenue asm mile opex asms cost seat casm operating merger profits passenger 2009 rise

Share:

Link:

Embed:

Download Presentation from below link

Download Presentation The PPT/PDF document "Delta Air Lines Cost and Productivity An..." is the property of its rightful owner. Permission is granted to download and print the materials on this web site for personal, non-commercial use only, and to display it on your personal computer provided you do not modify the materials and that you retain all copyright notices contained in the materials. By downloading content from our website, you accept the terms of this agreement.


Presentation Transcript

Slide1

Delta Air Lines Cost and Productivity Analysis

Ujaval PatelSlide2

Airline Information

Delta is considered a legacy carrier.

It has:

A heterogeneous fleet mix

Fleet hubs (Dom: ATL, DTW, MSP, LGA, SLC, JFK, CVG, MEM;

Int

: CDG, NRT, AMS)

Small percentage of unionized workers

Categorized seating classes

Seat assignments

Frequent flyer program

GDSSlide3

Definitions

RPM –Revenue Passenger Mile – One revenue paying passenger transported one mile. ∑

i

= 1 to All Flights

(# of revenue passengers * # of miles traveled)

ASMs – Available Seat Miles – One available seat flown 1 mile. ∑

i

= 1 to All Flights

(# of seats on flight * # of miles flown)

RASM – Revenue Per Average Seat Mile –Revenue made from each seat mile offered = Operating Revenue/ASMs

CASM – Cost Per Average Seat Mile -Cost to operate each seat per mile offered = Operating costs /ASMs

Yield – measure of the average fare paid by all passengers per mile flown. = Total Operating Revenue/ # Revenue Passenger Miles = Load Factor * Yield

PRASM - passenger revenue per ASM. = Total passenger revenue/ASM

Fuel Consumed – Total volume of fuel used

Fuel Costs per ASM = Fuel Cost / ASM

Non-Fuel Costs per ASM = (Operating Expenses – Fuel Costs)/ASMSlide4

RSM, ASM, and Load Factor Comparison

The trends shown represent the rise in 3

rd

Quarter RPMs and ASMs.

2010 showed a great increase in both RPMs and ASMs, though the trend seems to be tapering off a little, due to the merger with Northwest.

The load factor has gradually increased from ~80% to ~90% in 6 years.Slide5

Operating Revenue, Operating Expenses, and Income Before Taxes

The 3

rd

quarter is prime summer traveling season and sees the most RPMs and ASMs.

2008 and 2009 signal the high cost to keep up profits up even during the summer.

The merger in 2010 saw expenses and revenues dramatically rise, and this has led to higher Q3 profits.Slide6

RASM, CASM, Yield, PRASM

By 2009 the

yeild

was dropping and CASM was seeing a rise. This was cutting into profits.

With the merger in 2010, the

yeild

was climbing again and CASM was dropping . Though, currently CASM is back at 2009 levels.Slide7

Fuel OPEX, Non-Fuel OPEX, Fuel Consumption

The summer months tend to have higher than average fuel prices.

2008 saw a price spike in fuel prices and thus there was a spike in Fuel OPEX.

With the merger Fuel OPEX has increased steadily, while Non-Fuel OPEX and fuel consumption has remained relatively steady.Slide8

OPEX ASMs and Fuel Cost

The price of fuel saw a spike in 2008 and the price dropped back down in 2009, but it has steadily

creeped

up over the past 3 years.

As expected Fuel OPEX per ASM closely follows the trend of fuel cost. Where as Non-Fuel OPEX has remained fairly stable.Slide9

Final Thoughts

Fuel prices and dropping profits in Q3 were probably an indicator of two years of lost profits at Delta in 2008 and 2009.

With the merger in 2010 with Northwest fuel

e

xpenses did rise as the fleet size increased.

Additionally, airline expenses rose to handle the larger company that was formed.

With an increased market share and a drop in CASM after the merger profits rose, and have steadily risen since.