PPT-Example: Samples and Variables
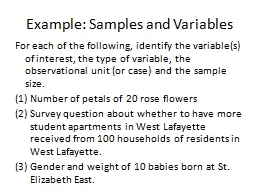
For each of the following identify the variables of interest the type of variable the observational unit or case and the sample size Number of petals of 20 rose
Download Presentation
"Example: Samples and Variables" is the property of its rightful owner. Permission is granted to download and print materials on this website for personal, non-commercial use only, provided you retain all copyright notices. By downloading content from our website, you accept the terms of this agreement.
Presentation Transcript
Transcript not available.