/
Fallacies in Numerical Reasoning Fallacies in Numerical Reasoning

Fallacies in Numerical Reasoning - PowerPoint Presentation

danika-pritchard
danika-pritchard . @danika-pritchard
Follow
383 views
Uploaded On 2018-03-11

Fallacies in Numerical Reasoning - PPT Presentation

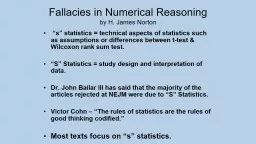
by H James Norton wwwjimnortonphdcom s statistics technical aspects of statistics such as assumptions or differences between ttest amp Wilcoxon rank sum test S Statistics study design and interpretation of data ID: 647280

data cancer patients study cancer data study patients statistics disease death age evidence population group rate died people suppose association frog 000

Share:

Link:

Embed:

Download Presentation from below link

Download Presentation The PPT/PDF document "Fallacies in Numerical Reasoning" is the property of its rightful owner. Permission is granted to download and print the materials on this web site for personal, non-commercial use only, and to display it on your personal computer provided you do not modify the materials and that you retain all copyright notices contained in the materials. By downloading content from our website, you accept the terms of this agreement.


Presentation Transcript

Slide1

Fallacies in Numerical Reasoningby H. James Norton, www.jimnortonphd.com

“s” statistics = technical aspects of statistics such as assumptions or differences between t-test & Wilcoxon rank sum test.

“S” Statistics = study design and interpretation of data.

Dr. John

Bailar

III has

said that the majority of the articles rejected at NEJM were due to “S” Statistics.

Victor Cohn – “The rules of statistics are the rules of good thinking codified.”

Most texts focus on “s” statistics.Slide2

I try to introduce “S” Statistics to my students using:Fallacies in Numerical ReasoningPapers with whoppers of mistakes“Wonderfully bad” articlesSlide3

References for Fallacies in Numerical Reasoning:

Andersen B.

Methodological Errors in Medical Research

Cohn V.

News and Numbers

Colton T.

Statistics in Medicine

Huff D.

How to Lie with Statistics

Moore D.

Statistics Concepts and Controversies

Roht L. Principles of Epidemiology:

A Self-Teaching Guide Slide4

From Huff’s“How to Lie with Statistics”

The following are profits (in millions $) per month from January to December:

20, 20.4,20.8, 20.9 21, 21.1, 21.2,21.2,21.4,21.6,21.8,22.

Suppose you want to show your boss how much the profits are growing over the year.

How should you graph the data?Slide5
Slide6

Suppose the data are exactly the same as before, but the data represent expenses.

Now you want to convince your boss that the expenses are not growing over the year.

How should you graph the data?Slide7
Slide8

An information service company ranked

the 1994 Honda Accord as the car most

likely to be stolen in the U.S. for 1996

(U.S. Today, January 27, 1997).

The company based its rankings on

the total number of cars stolen in 1996

by make and model.

Slide9

A spokesman for Honda objected to the analysis

Why did the Honda Corporation think this analysis was unfair?

What change in the analysis did the Honda Corporation recommend?Slide10

AnswerA) Because more Honda Accords were sold during this period than any other model of car in the U.S.B) They thought the number of cars stolen in each category should be divided by how many were on the road at this time and get a stolen car rate for each model.Slide11

This fallacy is known as a lack of denominatorsSlide12

Example (from Colton)

Sex and race distribution

of 158 cases of

abdominal aortic aneurysms

at metropolitan hospitals

in a Southern city

Sex & Race

#AAA

White Males

93

AA Males

30

White Females

22

AA Females

13Slide13

Authors’ Conclusion:The incidence of AAA is almost 3 times more frequent in Whites than African-Americans.Whites have greater risk of developing

AAA than African-Americans

.

.Slide14

What if the population of the city has 3 times as many whites as African-Americans?

Then this would not be a far comparison of the

2 groups. The number of AAA for each group needs to be divided by population of each group. Comparing rate of AAA per 100,000 between each of the 2 groups would be fair comparison.

This is another example of lack of denominators.Slide15

From: Statistics Concepts and Controversies by David MooreSlide16

Example (from Colton)A review of medical records for 3000 diabetic patientsApproximately two-thirds of patients at some time were 11% or more overweightConclusion: This provides evidence of an association between obesity and diabetes

Do you agree? What evidence is needed to prove the association?Slide17

What if

two-thirds of

non-diabetic

patients

at some time were 11% or more

overweight? Then there would be no association between

obesity and

diabetes in this study. A comparison group of non-diabetic patients is needed.

This fallacy is known as a

lack of a control group.Slide18

That Utah is a healthier environment than Florida is supported by the fact that in 2012 the mortality rate for Florida was 918 deaths per 100,000 population, while in Utah it was 519 deaths per 100,000 population, almost a twofold difference. Citizens of Florida should move to Utah so that they would probably live longer.Slide19

Why is this not a fair comparison of the two states & therefore what is wrong with this conclusion?

Utah has the lowest median age of all the states, while Florida is among the highest.

This fallacy is known as lack of age adjustment.Slide20

Median Age by State

Utah has the lowest median age (28.5).

Vermont

has the

highest

median age

(40.8). Slide21

Papadrianos E, Haagnesen CD, Cooley E. Cancer of the breast as a familiar disease. Ann Surg 1967;165:10-19.

Hypothesis: “Whether or not the transmission of a predisposition to mammary cancer carries with it a tendency to develop the disease at an earlier age.”Slide22

Results: “The mean age of the mothers was 59.7 years: that of the daughters 47.5 years. This difference of 12.2 is convincing evidence that mothers with mammary carcinoma pass on to their daughters a likelihood of developing the disease at an earlier age than they themselves get it.”Slide23

Conclusion:“No matter how statisticians may interpret

these data, they are too real to be ignored.” Slide24

Problems with the studyThere was a bias in that they compared only those pairs where the daughter had developed the disease

They did not consider the possibility of new techniques to detect cancer earlier

The phenomenon of anticipation in genetic diseases was not taken into accountSlide25

Galton (1889) studied the heights of sons compared to the heights of their fathers.In 2007, the average height of adult males in the U.S. is approximately 5’10”.

Suppose we study this relationship for tall fathers (6’4” or taller).

On average will their sons be approximately the same height, shorter, or taller than the fathers?Slide26

Shorter!Galton was surprised. He thought the sons would be at least as tall as their fathers due to better nutrition and health care.

What did Galton fail to consider?

The heights of the mothers!Slide27

Y = X

5’10

” mean line

Regression to the mean

Galton (1889

)

(hypothetical data)

Majority of sons are shorter than dad but taller than mean of 5’10”Slide28

Suppose a wizard claims to have invented an elixir that will lower blood pressure.Slide29
Slide30

To convince you it works he designs a clinical trial. He enrolls 100 patients who have a systolic pressure of at least 160. They take the “medicine” for 6 months.Suppose the elixir is just a placebo and he measures their BP at the end of the study.

On average will their BP be approximately the same, lower, or higher than at the start of the study?Slide31

On average their blood pressure will be lower! This is another example of

“Regression to the Mean”.Slide32

Suggest two ways to improve the design of his clinical trial.Measure each person several times to insure that they actually have high BP.Have a control group.Slide33

In 1918 there was an influenza pandemic.The next fallacy concerns this event.How many people died in the U.S. due to the flu during the pandemic?Approximately 500,000 to 675,000.

How many people died worldwide?

Approximately 20 – 40 million.Slide34

Immediately following the 1918 influenza pandemic there was a sharp decline in the tuberculosis mortality rate in the U.S.Does this provide evidence that an attack of the flu protects against TB?

No, since both diseases have a respiratory component, it may be that influenza killed those persons who might also be at a higher risk of dying from TB.Slide35

Survival-times after cardiac allograftsMessmer BJ, Nora JJ, Leachman RD, Cooley DA. The Lancet. May 10, 1969; 954-956.Slide36

57 patients who were eligible for a heart transplantPatients divided into those who did and did not receive a transplantEither time to death or follow-up time was recordedMean time to death or follow-up was computed for each group

The mean was higher in the group who received transplant (111 days vs. 74 days)Slide37

By utilizing the follow-up times for the patients who are still alive in the data analysis, statistically speaking, what have the authors done to these patients?Slide38

The authors treated the living patients as if they died on their last day of follow-up. Statistically speaking they murdered the patients still alive!Slide39

What statistical procedure correctly accountsfor patients who are lost to follow-up or still alive (censored)?Slide40

p = 0.861

log-rank testSlide41

A geneticist evaluates the charts of patients who are seen in his practice for a particular genetic disease, for example neurofibromatosis. He summarizes the data by the average life span and proportion of patients that have a full time job. In the discussion section of his article he reports on the short life span and the low percentage of people with neurofibromatosis who are employed.

Q. Why might his data be misleading and not apply to all people with the disease?

The patients the geneticist evaluates might have a more severe case of neurofibromatosis than the typical patient with the disease.

With neurofibromatosis, the severe patients have numerous tumors on

their body while the mildest cases have café-au-lait spots that might be misdiagnosed as a birthmarks or dermatological problems.

In a genetic study what is the name given to the original person in a family who identifies to the medical community that the family has a genetic disease?

A. Probands, propositus, or index cases.

Q. How do the probands compare in severity to the rest of the population

who also have the genetic disease?

They tend to have more severe disease. This is why they are the first family

members to be recognized with the disease.Slide42

TB Present

TB Absent

Cancer Present

54

762

Cancer Absent

133

683

Total

187

1445

Percent with Cancer

28.9%

52.7%

(

from Colton) A study was conducted to investigate a possible association between tuberculosis (TB) and cancer. The data was from autopsies performed at a large teaching hospital. For each person it was noted whether there were signs of cancer and whether TB was present. The following table was generated.

It appears that having TB offers a protection for developing cancer. Why is this apparent negative association between TB and cancer spurious?Slide43

A statistician named Berkson proved how misleading associations can occur from this type of data collection. He showed spurious relationships can result when the admission rates to the study are not the same for the different groups. In this example, suppose in the general population there is no relationship between having TB and having cancer. Further, assume the probabilities that a person is admitted to the hospital and autopsied are different for patients having only TB, only cancer, and having both TB and cancer. He showed that a false association between TB and cancer may appear in the results of the autopsy data. The false associations generated by these types of differing admission rates to a study are now referred to as examples of Berkson’s bias or Berkson’s fallacy. Slide44

Q. What does this graph suggest about the relationship between calories from animal food and intestinal cancer?

It suggests that the more calories from animal food a person

consumes, the more likely they are to develop intestinal cancer.Slide45

Q. What types of scientific studies would give stronger evidence of this relationship?

A. Retrospective case control study.

Prospective (observational) study.

Clinical trial.

Q. What is the name of the fallacy if the data grouped by country (i.e. the data from the graph) is contradicted by the better study?

A. An ecological fallacy.Slide46

Q. A company is concerned that a chemical used

at one of their plants may be a carcinogen. They compare the cancer rate of the workers exposed to the chemical to the cancer rates of the general population. Assume that age, race, and gender are similar between the two groups. Suppose that the cancer rates are identical to the rates for the general population and they conclude that the chemical is not a carcinogen. Why might this not be a fair comparison ?

A. People who are employed tend to be healthier than the general population. This phenomenon is known as the healthy worker effect.

Q. What would make a better control group?

A.

Workers doing similar type jobs but not exposed to the chemical.Slide47

(

from Roht) In a study of malignant melanoma among women, the survival rate among women who became pregnant and completed pregnancy after diagnosis was found to be higher than the rate among nonpregnant women of the same age. Does this information mean that a woman with melanoma should try to become pregnant in order to live longer?

First, those women who are not able to become pregnant may be those with the most severe forms of melanoma.

Second, those who completed pregnancy have an additional 9 months of survival by definition. Malignant melanoma is usually a disease of short duration. Nine months additional survival would bias the rate in favor of pregnant women.Slide48

“William Tucker’

s article brought to mind an experiment by a scientist with dubious credentials and recorded by him in his journal as follows.

Irving Lepselter, Letter-to-editor, NY Times, 11/16/1987Slide49

Day One

made loud noise behind frog. Frog jumped 15 feet.

Day Two

immobilized one hind leg of frog; then made same loud noise as on day one.

Frog jumped only 3 feet

Day Three

immobilized both hind legs of frog, then made many loud noises, louder than days one and two.

Frog did not jump at allSlide50

Conclusion

when both hind legs of a frog are immobilized,

it becomes deaf.

”Slide51

“Wonderfully bad” articlesEight published medical & dental papers with numerous mistakes that undergraduates with one semester of biostatistics can detectAllow for a wide range of critical ability and insightHandout – from Colton

“Outline for critique of a medical report”Slide52

What’s the chemical toxin being studied and which character is associated with the toxin?Slide53

Felt hat makers were exposed to mercuric oxide.They developed mercury poisoning that lead to psychological problems.

Hence the term “Mad as a Hatter.”Slide54

“The relationship between mercury from dental amalgam and mental health”by SL Siblerud

Part I of study

70 volunteers (college students) divided into those with and without any dental amalgams (fillings) that contain mercury

Given a mental health questionnaire

Two groups compared on measures of mental healthSlide55

Author’s Conclusion:“The amalgam group appeared to have a poor lifestyle. They craved and ate more sweets, smoked more cigarettes, consumed more alcohol…”Do you think this is convincing evidence that the mercury in the amalgams is causing a poorer choice in lifestyle?

The more likely explanation is that the sweets, smoking, and alcohol caused cavities, and hence

led

to the presence of amalgams, rather than the mercury from the fillings caused the poorer lifestyle.Slide56

INTERESTING EXAMPLESOF THE USE & MISUSE OF STATISTICS FROM THE LAW

Slide57

Oliver Wendell Holmes, Jr.Slide58

Oliver Wendell Holmes, Jr.The Path of the Law10 Harvard Law Review

(1897): 457-469.

“For the rational study of the law the black letter man may be the man of the present, but the man of the future is the man of statistics and the master of economics.” Slide59

People v. Collins (1968)Crim. No. 11176

Supreme Court of California

March 11, 1968

A woman had her purse stolen.

The witnesses did not get a good look at the robber’s face.

Witnesses were able to describe some characteristics of the robber, the get-away car, and the driver.

Prosecution calls an Instructor of Mathematics to testify.

Instructor explains the product rule for multiplying probabilities of independent events.Slide60

Prosecutor suggests these probabilities:Black man with a beard 1 in 10

Man with a moustache 1 in 4

White woman with pony tail 1 in 10

White woman with blonde hair 1 in 3

Yellow automobile 1 in 10

Interracial couple in car 1 in 1000

Asks instructor what the probability would be under these estimates.

1 in 12,000,000.

Prosecutor claims these estimates are conservative.

“Chances of having every similarity … something like

1 in a billion.”

Jury finds defendant guilty.Slide61

The ruling of the appeal’s court:

“It is a curious circumstance of this adventure in proof that the prosecutor not only made his own assertions of these factors in the hope that they were conservative… but invited the jury to substitute their estimates.”

“There was another glaring defect in the prosecution’s technique, namely an inadequate proof of the statistical independence of the six factors.”Slide62

The final ruling of the appeals court:

“Mathematics, a veritable sorcerer in our computerized world,

while assisting the trier of fact in the search for truth,

must not cast a spell over him. We reverse the judgment.”Slide63

The Sally Clark CaseSlide64

Sally Clark was a solicitor in Cheshire, England.Her son, Harry Clark, born 3 weeks premature, died 8 weeks after birth.In addition, her first child had died less than 3 weeks after birth. His autopsy concluded he had died of natural causes. He had signs of a respiratory infection.

She was arrested for 2 counts of murder, despite the fact that there was very little evidence against her.Slide65

Sally had no history of violent or unusual behavior. Harry had some evidence of being shaken but this was consistent with her report to the police that she had shaken the baby when she noticed that he was not breathing.

Prosecutor’s main argument was that it would be very unlikely that 2 babies in same family would die of cot death. In the U.S. we would use the term Sudden Infant Death Syndrome (SIDS).Slide66

Prosecution calls Sir Roy Meadow

Professor of Paediatrics

St. James University Hospital

President British Paediatric Association

1994-1997Slide67

His testimony

was

based

on

the

Confidential

Enquiry

for

Stillbirths

and

Deaths,

a

study of deaths of babies in infancy, in 5 regions of England from 1993 to 1996.Probability random baby dies of a cot death = 1 in 1303.Probability random baby dies of a cot death if the mother is > 26 years old, affluent, and a non smoker = 1 in 8543.Probability two children from such a family both die from a cot death = (1 in 8543) x (1 in 8543) = 1 chance in 73 million.Slide68

Judge’s summary to jury, “Although we do not convict people in these courts on statistics, … the statistics in this case are compelling.”

Jury convicts on a 10 to 2 vote.

One juror said, “Whatever you say about Sally Clark, you can’t get round the 1 in 73 million figure.”

Sally’s conviction upheld on appeal. Slide69

2001, Royal Statistical Society issues a news brief condemning the use of the multiplication rule for independence in this case. “This approach is statistically invalid. … The well publicized figure of 1 in 73 million has no statistical basis.”

2002, Ray Hill, Professor of Mathematics at the University of Salford, analyses other published data. He concludes the probability of having a second child die a cot death, given a first child in a family died a cot death, may be as high as 1 in 60. Slide70

In 2003, after spending 3 years in jail, Sally’s second appeal was upheld, and she was released from jail. This was only after a new pro bono lawyer, while reviewing the evidence, discovered a pathology report revealing that Harry was infected with staphylococcus aureus and that this fact had been hidden from her defense team.

Two other women whom Meadow had testified against at the murder trial of their children were released upon appeal.

In 2007, Sally Clark died, of apparently natural causes, due to acute alcohol intoxication.Slide71

New Evidence on S. aureus & SIDS“Infection and sudden unexpected death in infancy (SUDI): a systematic retrospective case review. M.A. Weber. Lancet May 31 2008;371:1848-53.

“Significantly more cultures from infants whose death was unexplained contained S. aureus (262/1628, 16%) than did those from infants whose deaths were of a non infective cause (19/211, 9%, p=0.005).

From editorial by Morris, “but this work … provides support for the idea that S. aureus and E. coli could have a causal role in some cases of unexplained SUDI.”