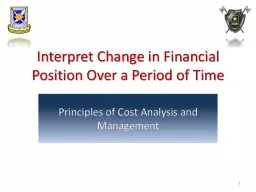
/
Interpret Changes in a Financial Position Over a Period of Time Interpret Changes in a Financial Position Over a Period of Time

Interpret Changes in a Financial Position Over a Period of Time - PowerPoint Presentation

danika-pritchard
danika-pritchard . @danika-pritchard
Follow
352 views
Uploaded On 2018-12-24

Interpret Changes in a Financial Position Over a Period of Time - PPT Presentation

Intermediate Cost Analysis and Management 1 Why is it useful to know an entitys financial position 2 Terminal Learning Objective Action Interpret Changes in a Financial Position Over a Period of ID: 745459

position financial jan assets financial position assets jan statement net 000 liabilities simmons house total cash madge 230 mortgage

Share:

Link:

Embed:

Download Presentation from below link

Download Presentation The PPT/PDF document "Interpret Changes in a Financial Positio..." is the property of its rightful owner. Permission is granted to download and print the materials on this web site for personal, non-commercial use only, and to display it on your personal computer provided you do not modify the materials and that you retain all copyright notices contained in the materials. By downloading content from our website, you accept the terms of this agreement.


Presentation Transcript

Slide1

Interpret Changes in a Financial Position Over a Period of Time

Intermediate Cost Analysis and Management

1Slide2

Why is it useful

to know an entity’s financial position?

2Slide3

Terminal Learning Objective

Action: Interpret Changes in a Financial Position Over a Period of

Time

Condition

: You are training to become an ACE with access to ICAM course handouts, readings, and spreadsheet tools and awareness of Operational Environment (OE) variables and actorsStandard:

W

ith at least 80% accuracy:

Classify assets & liabilitiesClassify revenues and expenses (cash basis)Enter relevant report data to solve Financial Position equation (using macros provided in Excel template)

3Slide4

Meet the Simmons Family

Gomer, Madge and kids:

Bert, Lacy and baby

Maddie

Stunt doubles for a popular cartoon familyTask: Calculate the family’s Financial Position

4Slide5

What is Financial Position?

Financial position is represented by the equation: Assets – Liabilities = Financial Position Or

Assets = Liabilities + Financial Position

Financial Position may also be called Equity or Net Assets

5Slide6

What’s an Asset?

An Asset is:Something you OWN

R

epresents

FUTURE BENEFITWhat kinds of assets might the Simmons family own?6Slide7

What’s an Asset?

An Asset is:Something you OWN Represents

FUTURE BENEFIT

What kinds of assets might the Simmons family own?

7Slide8

What’s an Asset?

An Asset is:Something you OWN

R

epresents

FUTURE BENEFITWhat kinds of assets might the Simmons family own?8Slide9

What’s an Asset?

An Asset is:Something you OWN

R

epresents

FUTURE BENEFITWhat kinds of assets might the Simmons family own?9Slide10

What’s a Liability?

A Liability is:Something you OWE

Represents

FUTURE SACRIFICE

A creditor’s CLAIM against your assetsWhat kinds of Liabilities might the Simmons family have?

10Slide11

What’s a Liability?

A Liability is:Something you OWERepresents

FUTURE SACRIFICE

A

creditor’s CLAIM against your assetsWhat kinds of Liabilities might the Simmons family have?

11Slide12

What’s a Liability?

A Liability is:Something you OWERepresents

FUTURE SACRIFICE

A

creditor’s CLAIM against your assetsWhat kinds of Liabilities might the Simmons family have?

12Slide13

What’s a Liability?

A Liability is:Something you OWERepresents

FUTURE SACRIFICE

A

creditor’s CLAIM against your assetsWhat kinds of Liabilities might the Simmons family have?

13Slide14

What’s a Liability?

A Liability is:Something you OWERepresents

FUTURE SACRIFICE

A

creditor’s CLAIM against your assetsWhat kinds of Liabilities might the Simmons family have?

14Slide15

LSA #1 Check on Learning

Q1. What is the equation to represent financial position?

A1.

Q2

. Which element of the equation represents future benefits of the entity?A2.

15Slide16

LSA #1 Summary

During this lesson, we introduced the Financial Position equation and discussed some accounting terminology with definitions.

16Slide17

Sorting the Data

Madge’s stack of papers contains the following:Deed to the house $230,000

Mortgage note on house 225,000

Title to the car 6,000

Grocery receipts 400Furniture receipts 3,000Credit card statements 2,300 Property tax bill 2,500 The kids’ birth certificates -0-Hospital bill for

Maddie

950

Clothing receipts 750Bank Statement (reconciled balance) 307.47Cash in Madge’s purse

20

Task: Calculate the Simmons’ Net Worth

17Slide18

Sorting the Data

Madge’s stack of papers contains the following:

Deed to the house $230,000

Mortgage note on house 225,000

Title to the car 6,000Grocery receipts 400Furniture receipts 3,000Credit card statements 2,300 Property tax bill 2,500

The kids’ birth certificates -0-

Hospital bill for

Maddie 950Clothing receipts 750

Bank Statement (reconciled balance) 307.47

Cash in Madge’s purse

20

Task: Calculate the Simmons’ Net Worth

18Slide19

Sorting the Data

Madge’s stack of papers contains the following:

Deed to the house $230,000

Mortgage note on house 225,000

Title to the car 6,000Grocery receipts 400Furniture receipts 3,000

Credit card statements 2,300

Property tax bill 2,500 The kids’ birth certificates -0-

Hospital bill for

Maddie

950

Clothing receipts 750

Bank Statement (reconciled balance) 307.47

Cash in Madge’s purse

20

Task: Calculate the Simmons’ Net Worth

19Slide20

Classifying Assets & Liabilities

Assets:House $230,000

Car 6,000

Furniture

3,000Clothing 750Cash (Bank + purse) 327.47Total $240,077.

47

Liabilities:

Mortgage $225,000

Credit Card 2,300

Property Tax 2,500

Hospital

950

Total

$230,750

Financial Position or Net Worth =

$240,077.

47

- $230,750 =

$9,327.

47

20Slide21

Graphic Solution

21Slide22

LSA #2 Check on Learning

Q1. Which of the following would be considered a liability?

A1.

Checking account $327

Credit card account $246Groceries $50Q2. Assuming these are the only relevant items, what is the financial position?

A2.

22Slide23

LSA #2 Summary

During this lesson, we distinguished the difference between assets and liabilities, and gave clear examples of each.

23Slide24

Reporting Financial Position

The Statement of Financial Position presents the financial position of an entity as of a SINGLE DATE. May also be called:Balance Sheet (for-profit entity)

Statement of Net Assets (not-for-profit entity)

Statement of Net Worth (individual or family)

24Slide25

Statement of Financial Position

Assets:

House $230,000

Car 6,000

Furniture 3,000Clothing 750Cash (Bank + purse) 327.47

Total

$240,077.

47Liabilities:

Mortgage $225,000

Credit Card 2,300

Property Tax 2,500

Hospital

950

Total

Liab

. $

230,750

Net Worth 9,327.

47

Total

$

240,077.

47

25Slide26

What about the groceries?

Items that will be consumed during the current month are considered ExpensesWhat about the kids?

Questions

26Slide27

Questions

What about the groceries?Items purchased and consumed during the current period are considered Expenses

What about the kids?

First, would they be assets or liabilities?

Second, they aren’t “owned”Third, their value cannot be quantified monetarily

Monetary Unit Assumption:

F

inancial information must be measured and reported in a monetary unit such as U.S. Dollars27Slide28

Questions

What about the groceries?I

tems purchased and consumed during the current period are considered Expenses

What about the kids?

First, would they be assets or liabilities? Second, they aren’t “owned”Third, their value cannot be quantified monetarily

Monetary Unit Assumption:

F

inancial information must be measured and reported in a monetary unit such as U.S. Dollars28Slide29

Questions

What about the groceries?I

tems purchased and consumed during the current period are considered Expenses

What about the kids?

First, would they be assets or liabilities? Second, they aren’t “owned”

Third, their value cannot be quantified monetarily

Monetary Unit Assumption:

Financial information must be measured and reported in a monetary unit such as U.S. Dollars

29Slide30

Questions

What about the groceries?I

tems purchased and consumed during the current period are considered Expenses

What about the kids?

First, would they be assets or liabilities? Second, they aren’t “owned”

Third, their value cannot be quantified monetarily

Monetary Unit Assumption:

Financial information must be measured and reported in a monetary unit such as U.S. Dollars

30Slide31

Questions

What about the groceries?I

tems purchased and consumed during the current period are considered Expenses

What about the kids?

First, would they be assets or liabilities? Second, they aren’t “owned”

Third, their value cannot be quantified monetarily

Monetary Unit Assumption:

Financial information must be measured and reported in a monetary unit such as U.S. Dollars

31Slide32

Questions

Isn’t the house worth more now than when they bought it?P

ossibly, but it’s difficult to objectively determine its value

Cost Principle:

The most objective measure of an asset’s value is its HISTORICAL COST: the price paid for it in an arm’s length transactionIs it necessary to report the 47₵ from the bank account?Materiality Constraint:

Report only the level of detail that will affect a user’s decision

32Slide33

Questions

Isn’t the house worth more now than when they bought it?Possibly, but it’s difficult to objectively determine its value

Cost Principle:

The most objective measure of an asset’s value is its HISTORICAL COST: the price paid for it in an arm’s length transaction

Is it necessary to report the 47₵ from the bank account?Materiality Constraint: Report only the level of detail that will affect a user’s decision

33Slide34

Questions

Isn’t the house worth more now than when they bought it?P

ossibly, but it’s difficult to objectively determine its value

Cost Principle:

The most objective measure of an asset’s value is its HISTORICAL COST: the price paid for it in an arm’s length transactionIs it necessary to report the 47₵ from the bank account?Materiality Constraint:

Report only the level of detail that will affect a user’s decision

34Slide35

Questions

Isn’t the house worth more now than when they bought it?P

ossibly, but it’s difficult to objectively determine its value

Cost Principle:

The most objective measure of an asset’s value is its HISTORICAL COST: the price paid for it in an arm’s length transactionIs it necessary to report the 47₵ from the bank account?Materiality Constraint:

Report only the level of detail that will affect a user’s decision

35Slide36

LSA #3 Check on Learning

Q1

. What is the name of the report that presents a government organization’s financial position? An individual’s?

A1.

Q2. What is the time frame of this report?A2.

Q3

. What

principle defines the value that should be reported for an asset on the Statement of Financial Position? A3.

36Slide37

LSA #3 Summary

During this lesson, we completed a statement of financial position complete with assets and liabilities, and posed some relevant questions pertaining to the process.

37Slide38

What if Gomer inherits $1,000,000?

38Slide39

Changes in Financial Position

The Statement of Financial Position (Balance Sheet) reflects the Assets, Liabilities and Net Assets as of a SINGLE DATE. (Like a snapshot)

Beginning

Financial

Position

Ending

Financial

Position

Statement of Activities

39Slide40

Changes in Financial Position

The Statement of Activities, or Income Statement, reflects activity for a period of time. (Like a video)

Beginning

Financial

Position

Ending

Financial

Position

Statement of Activities

40Slide41

Changes in Financial Position

Under the Cash Basis of Accounting:Revenues:

Represent earnings received in cash

Increase Assets and Increase Financial Position

Costs:Represent cash payments for goods and services receivedDecrease Assets and Decrease Financial PositionRepresent cash payments for goods and services receivedDecrease Assets and Decrease Financial Position

Reve

Revenues – Costs =

Net Change in Financial Position

nues – Costs =

Net Change in Financial Position

41Slide42

LSA #4 Check on Learning

Q1. What is the equation for the change in financial position?

A1.

Q2

. What is the name of the statement that describes changes in financial position?A2.

42Slide43

LSA #4 Summary

During this lesson, we discussed the summary of changes in a financial position and provided the following formula;ReveRevenues – Costs =

Net Change in Financial Position

43Slide44

The Simmons:

Statement of Financial Position

1/1/XX

Assets:

House $230,000

Car 6,000

Furniture

3,000Clothing 750

Cash 327

Total

$240,077

Liabilities:

Mortgage $225,000

Credit Card 2,300

Property Tax 2,500

Hospital

950

Total Liabilities $230,750

Net Assets:

9,327

Total

$240,077

44

NOTE

: XX represents current FY.Slide45

The Simmons: Financial Activity for January

Date

Activity

Cash

Amount

2-Jan

Madge

puts gasoline in the car

120

4-Jan

Gomer buys

doughnuts

35

7-Jan

Gomer’s

paycheck

925

8-Jan

Madge buys groceries

600

12-Jan

Lacy has a dentist appointment

100

14-Jan

Bert breaks a window

50

15-Jan

Madge

babysits the neighbor kids

25

21-Jan

Gomer’s

paycheck

925

22-Jan

Madge pays

interest on mortgage

938

Task: Calculate the Net Change in Financial Position for January.

45Slide46

The Simmons: Financial Activity for January

Date

Activity

Cash

Amount

2-Jan

Madge

puts gasoline in the car

120

4-Jan

Gomer buys

doughnuts

35

7-Jan

Gomer’s

paycheck

925

8-Jan

Madge buys groceries

600

12-Jan

Lacy has a dentist appointment

100

14-Jan

Bert breaks a window

50

15-Jan

Madge

babysits the neighbor kids

25

21-Jan

Gomer’s

paycheck

925

22-Jan

Madge pays

interest on mortgage

938

Task: Calculate the Net Change in Financial Position for January.

46Slide47

The Simmons: Financial Activity for January

Date

Activity

Cash

Amount

2-Jan

Madge

p

uts

gasoline in the car

120

4-Jan

Gomer buys

doughnuts

35

7-Jan

Gomer’s

paycheck

925

8-Jan

Madge buys groceries

600

12-Jan

Lacy has a dentist appointment

100

14-Jan

Bert breaks a window

50

15-Jan

Madge

babysits the neighbor kids

25

21-Jan

Gomer’s

paycheck

925

22-Jan

Madge pays

interest on mortgage

938

Task: Calculate the Net Change in Financial Position for January.

47Slide48

The Simmons:Changes in Financial Position

What are the Revenues?

Gomer’s pay and Madge’s babysitting $

1875

gross pay and Madge’s babysitting What are the Costs? Gasoline, doughnuts, groceries, dentist, window, and mortgage

interest = $

1843

ax withholding , gasoline, doughnuts, groceries, dentist, window, and mortgage interestWhat is the Net Change in Financial Position?

Revenues

$1875 – Costs $1843 = $32

Increase

Revenues $2,025 – Costs $1,993 = 2 Increase

What is the Ending Financial Position?

Beginning

$9,327 + Increase $32 = Ending $9,359

Beginning $9,327 + Increase $32 = Ending $9,359

48Slide49

The Simmons:

Statement of Activities

for month of January 20XX

Revenues:

G

omer’s Salary (Net) $1,850

Madge’s babysitting

25 Total Revenues $1,875Costs:

Interest $938

Groceries 600

Gasoline 120

Dentist 100

Broken Window 50

Doughnuts

35

Total Costs

1,843

Net Change in Financial Position 32

Add: Financial Position January 1, 20XX

9,327

Financial Position January 31, 20XX

$9,359

49Slide50

Graphic Representation of Net Change

$32

$1875

$1843

50Slide51

$32

$9359

$9327

51

Graphic Representation of Net ChangeSlide52

The Simmons:

Statement of Financial Position

1/31/XX

Assets:

House $230,000

Car 6,000

Furniture

3,000Clothing 750

Cash (325+32) 359

Total

$240,109

Liabilities:

Mortgage $225,000

Credit Card 2,300

Property Tax 2,500

Hospital

950

Total Liabilities $230,750

Net Assets:

9,359

Total

$240,109

52Slide53

LSA #5 Check on Learning

Q1. What activities will cause financial position to increase?

A1.

Q2

. What activities will cause financial position to decrease?A2.

53Slide54

LSA #5 Summary

In this lesson, we conducted a demonstration problem based on a given scenario. This involved revenues and costs that were eventually plugged into a formula, resulting in a graphed representation of the answers.

54Slide55

Enter data in the white spaces

55

Financial Position SpreadsheetSlide56

Use Tabs to Navigate

56

Financial Position SpreadsheetSlide57

Financial Position Spreadsheet

The spreadsheet uses the data you entered to produce the Statement of Financial Position and the pie graph

57Slide58

Statement of Activities Spreadsheet

Enter Transaction Data into the register

58Slide59

After entering Data,

Press button to

Create Statement

Of Activities

59

Financial Position SpreadsheetSlide60

Statement of Activities Spreadsheet

Statement of Activities shows:

Total Revenues,

Total Costs ,

Change in Financial Position, and Ending Financial Position

60Slide61

Conduct Practical Exercise

61Slide62

TLO Summary

Action: Interpret Changes in a Financial Position Over a Period of Time

Condition:

You are training to become an ACE with access to ICAM course handouts, readings, and spreadsheet tools and awareness of Operational Environment (OE

) variables and actorsStandard: With at least 80% accuracy:

Classify

assets &

liabilitiesClassify revenues and expenses (cash basis)Enter relevant report data to solve Financial Position equation (using macros provided in Excel template)

62