PDF-Kilograms of CO2 per passenger kilometre for different modes of transp
Author : danika-pritchard | Published Date : 2015-08-21
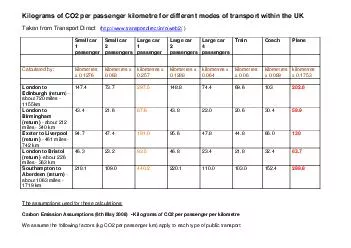
Small car1 passenger Small car 2 passengers Large car 1 passengerLarge car2 passengers Large car4 passengers TrainCoachPlane Calculated bykilometres x 01276kilometres
Presentation Embed Code
Download Presentation
Download Presentation The PPT/PDF document "Kilograms of CO2 per passenger kilometre..." is the property of its rightful owner. Permission is granted to download and print the materials on this website for personal, non-commercial use only, and to display it on your personal computer provided you do not modify the materials and that you retain all copyright notices contained in the materials. By downloading content from our website, you accept the terms of this agreement.
Kilograms of CO2 per passenger kilometre for different modes of transp: Transcript
Download Rules Of Document
"Kilograms of CO2 per passenger kilometre for different modes of transp"The content belongs to its owner. You may download and print it for personal use, without modification, and keep all copyright notices. By downloading, you agree to these terms.
Related Documents