/
Annexure A: Detailed Quarterly Performance Annexure A: Detailed Quarterly Performance

Annexure A: Detailed Quarterly Performance - PowerPoint Presentation

davies
davies . @davies
Follow
27 views
Uploaded On 2024-02-02

Annexure A: Detailed Quarterly Performance - PPT Presentation

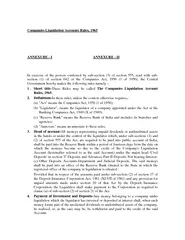
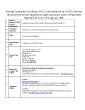
1 Centre of Public Service Innovation 2 Programme 1 Administration Indicator Target Q2 Output Q2 Reason for Deviation Q2 Percentage of external audit recommendations implemented Implementation report developed ID: 1043689

number deviation q2reason programme deviation number programme q2reason report implementation q2output 2019 percentage national department development public reports management

Share:

Link:

Embed:

Download Presentation from below link

Download Presentation The PPT/PDF document "Annexure A: Detailed Quarterly Performan..." is the property of its rightful owner. Permission is granted to download and print the materials on this web site for personal, non-commercial use only, and to display it on your personal computer provided you do not modify the materials and that you retain all copyright notices contained in the materials. By downloading content from our website, you accept the terms of this agreement.


Presentation Transcript

1. Annexure A: Detailed Quarterly Performance1

2. Centre of Public Service Innovation2Programme 1: AdministrationIndicatorTarget Q2Output Q2Reason for Deviation Q2Percentage of external audit recommendations implementedImplementation report developedImplementation report developedNoneNumber of quarterly consolidated financial and non-financial reports free from material misstatements submitted to MPSA, DPSA, DPME and National Treasury as per required timeframes First quarter financial report submitted to MPSA, DPSA and National Treasury and non-financial report submitted to MPSA, DPSA, DPME and National Treasury by 31 July 2019NonePercentage of external audit recommendations implemented Implementation report developedNoneNumber of quarterly consolidated financial and non-financial reports free from material misstatements submitted to MPSA, DPSA, DPME and National Treasury as per required timeframesFirst quarter financial report submitted to MPSA, DPSA and NT and non-financial report submitted to MPSA, DPSA, DPME and NT by 31 July 2019First quarter financial report submitted to MPSA, DPSA and National Treasury and non-financial report submitted to MPSA, DPSA, DPME and National Treasury by 31 July 2019None

3. Centre of Public Service InnovationProgramme 2: Public Sector Innovation3IndicatorTarget Q2Output Q2Reason for Deviation Q2Number of knowledge platforms hosted to unearth, demonstrate, share, encourage and award innovation in the public sector2019 Annual Public Sector Innovation Conference hostedThree out of the four Innovation workshops that were supposed to be held in the fourth quarter were then conducted in the 2nd QuarterLoss of capacity posed a challenge for the delivery of key programmes reflected in the current APP, it was therefore decided to combine the conference and the awards Number of SADC or international programmes participated in to profile and strengthen national and regional capacityParticipated in one (1) SADC or International innovation programmeParticipated in two (2) SADC or International innovation programmeThe CPSI participated in the OECD Governance Meeting with side engagements on Foresight on 15-17 April 2019 in Paris, the Continental Africa Public Service Day on 17-24 June 2019 in KenyaNumber of innovative solutions developed to address service delivery challenges -Consultation on innovative solutions to be developed held with the DPSA, potential innovators and the UNDPNoneRevised Pocket Guide to Innovation in the South African Public Sector disseminated through existing platforms -Planning meetings held with designer.ToRs for online guide draftedDesign delayed due to the loss of internal design capacityNumber of knowledge platforms hosted to unearth, demonstrate, share, encourage and award innovation in the public sector -Three out of the four Innovation workshops that were supposed to be held in the fourth quarter were then conducted in the 2nd QuarterLoss of capacity posed a challenge for the delivery of key programmes reflected in the current APP, it was therefore decided to combine the conference and the awards to maximise the limited capacity whilst achieving two targets in the APP

4. Centre of Public Service Innovation: Programme 2: Public Sector InnovationIndicatorTarget Q2Output Q2Reason for Deviation Q2Number of SADC or international programmes participated in to profile and strengthen national and regional capacity -Participated in two (2) SADC or International innovation programmeThe CPSI participated in the OECD Governance Meeting with side engagements on Foresight on 15-17 April 2019 in Paris, the Continental Africa Public Service Day on 17-24 June 2019 in KenyaNumber of innovative solutions developed to address service delivery challengesConsultation on innovative solutions to be developedConsultation on innovative solutions to be developed held with the DPSA, potential innovators and the UNDPNoneRevised Pocket Guide to Innovation in the South African Public Sector disseminated through existing platformsRevised pocket guide designed and publishedPlanning meetings held with designer.ToRs for online guide draftedThe Design and online publication of the revised pocket guide was delayed due to the loss of internal design capacity4

5. Civilian Secretariat for PoliceProgramme 1: AdministrationIndicatorTarget Q2Output Q2Reason for Deviation Q2Number of joint consultative Independent Police Investigative (IPID)/Secretariat forum meetings held per year in compliance with the CSPS Act, 201111N/AMaintain vacancy rate not more than 7% of the total post establishmentNot more than 7%8.44%The department had two exits during the reporting period. Furthermore, the process of filling three additional posts that were created in June is not yet finalizedPercentage of payments made to creditors within 30 days96 %99 %The measures of tracking invoices and payments are being implemented.Percentage of Internal Audit recommendations implemented75 %63 %The outstanding recommendations can only be implemented during Q3 and Q4 as they are linked to the budget and expenditure processes5

6. Civilian Secretariat for PoliceProgramme 1: Administration6IndicatorTarget Q2Output Q2Reason for Deviation Q2Percentage of external audit recommendations implemented0 %100 %In Q2, the department developed an action plan progress report to address the findings raised by the Auditor General. Out of the total findings identified, three recommendations were implemented prior to the completion of the audit.Percentage expenditure in relation to budget allocated50 %44 %The reported underspending was mainly due to vacant funded posts.

7. Programme 2: Intersectoral Coordination and Strategic PartnershipsIndicatorTarget Q2Output Q2Reason for Deviation Q2Number of monitoring reports on implementing CPF regulations/ standards approved by the Secretary for Police per year11N/ANumber of MoUs signed with stakeholders per year to build safer communities10At the end of the quarter under review, the MoU was completed but not yet approvedNumber of workshops facilitated with Provincial Secretariats and municipalities on the establishment of CSFs per year33N/ANumber of provincial capacity-building sessions held on crime prevention policies per year13N/ANumber of anti-crime campaigns conducted per year12An additional Anti-Crime Campaign was held in response to the ongoing Western Cape's battle with crime.Number of izimbizo/public participation programmes held with communities to promote community safety per year23An additional Izimbizo was held in response to the crime problems in communities.7

8. Programme 3: Legislation and Policy DevelopmentIndicatorTarget Q2Output Q2Reason for Deviation Q2Number of policies on policing submitted to the Secretary for Police Service for approval per year00N/ANumber of Bills submitted to the Minister for approval per year00N/A8

9. Programme 4: Civilian Oversight, Monitoring and EvaluationIndicatorTarget Q2Output Q2Reason for Deviation Q2Number of Assessments Reports on Complaints Management approved by the Secretary per year01The report was not finalised in Q1 due to delays in the analysis of information.Number of reports on SAPS implementation IPID Recommendations approved by the Secretary per year01The report was not finalised in Q1 due to data discrepancies.Number of reports on the implementation and compliance to legislation and policies approved by the Secretary per year10Delays in project implementation due to the changes related to the focus area.Number of reports on the functioning of the National Forensic DNA Database assessed per year10The assessment report has been compiled but not yet approved.Number of Police Station Oversight Reports approved by the Secretary per year10The size of the sample was increased to improve coverage, and that prolonged the data collection process.Number of compliance reports on the implementation of the Domestic Violence Act (98) by SAPS approved by the Secretary per year01The report was not finalised in Q1 due to delays in the analysis of information.9

10. Department of Arts and CultureProgramme 1: AdministrationIndicatorTarget Q2Output Q2Reason for Deviation Q2No. of communication and marketing campaigns implemented to profile the Department22Not applicable % of total value of procurement awarded to BBBEE-compliant service providers70 %73.53 %More procurement was awarded to BBBEE-compliant service providersNo. of Izimbizo held55Not applicable 10

11. Programme 2: Institutional GovernanceIndicatorTarget Q2Output Q2Reason for Deviation Q2Number of departmental and entities’ performance information reports or documents approved33Not applicable Approved feasibility and due diligence reports on amalgamation of DAC public entitiesDraft report on feasibilitystudy and due diligencereport developedDraft report on feasibility study and due diligence report developed and approved by the DGNot applicable No. of cultural diplomacy engagements coordinated55Not applicable 11

12. Programme 2: Institutional GovernanceIndicatorTarget Q2Output Q2Reason for Deviation Q2No. of national days commemorated22Not applicable Number of reports on the implementation of the social cohesion compact00Not applicable No. of community conversations held22Not applicable No. of social advocacy platforms held55Two of the platforms were declared as not achieved due to inadequate corroborating evidence during assessmentNo. of Arts and Youth Development Programmes supported.11Not applicable No.of CEO's Forums held11Not applicable No. of governance tools implemented for DAC public entities1 x governance tool(induction of newlyappointed councils)1 governance tool was implemented through the induction of newly appointed councils for the following DAC Public entities: RIM, SAHRA, Iziko and DitsongNot applicable 12

13. Programme 3:Arts and Culture Promotion and DevelopmentIndicatorTarget Q2Output Q2Reason for Deviation Q2No. of multi-year HLT projects supported15Five multi-year HLT projects were declared as not achieved due to inadequate corroborating evidence during assessment.No. of market access platforms supported35Additional two projects, Torino and Uganda fashion Weeks were done through an SCM process.% of documents received and accepted that are translated and/or edited100 %100 %Not applicable No. of cultural and creative sector projects supported through MGE3013Delay in the creation of items by National Treasury due to backlog of MOAs to be processed by DAC legal services.No. of provincial community arts programmes supported30The annual target of 9 programmes to be supported has been subdivided into 4 which will be project managed by a service provider and 5 which will be project managed by DAC officials. There were delays in signing of the SLA with the service provider. No. of reports produced by SACO56The Country Brief for Sweden was completed sooner to coincide with Departmental visit to the Gothenburg Book Fair in Sweden hence the extra report.No.of sector organisations supported 42Delay in the finalisation of the MOA has had a knock on effect on the dates the projects has started and as a result the current submission dates could not be met13

14. Programme 4: Heritage Promotion and PreservationIndicatorTarget Q2Output Q2Reason for Deviation Q2No. of Gazette notices on standardisation of geographical names published11Not applicable No. of newly built and/or modular libraries supported financiallyFinancial support tothe newly built and /or modular librariescontinued32Not applicableNo. of multi–year heritage infrastructure projects completedOR Tambo Gardenof RemembranceConstruction Mrs WinnieMadikizela-MandelaBrandfort Site ConstructionTwo multi-year infrastructure projects in progress. OR Tambo is at 50% completion rate and progress report developed. Winnie Madikizela-Mandela is at 85% completion rate and a progress report developedNot applicableFeasibility study report on Resistance and Liberation Movements Museum submitted to CabinetDraft feasibility studyreport presented to Inter-Ministerial Committee(IMC) and SPCHD TechnicalWorking Group (TWG) andinput incorporatedThe Draft Feasibility Report for the RLMM was presented to Social Protection, Community and Human Development (SPCHD) Technical Working Group (TWG) on 13 August 2019 and to the RLHR Inter-Ministerial Committee on 13 September 2019Not applicable14

15. Programme 4: Heritage Promotion and Preservation15IndicatorTarget Q2Output Q2Reason for Deviation Q2No. of archival collections digitisedDigitisation of Treason TrialDigitisation ofDictabelts continuedDigitisation of the CODESARecords13 362 Archival Collections were digitised as follows:TRC 104, Treason Trial Dictabelts 157 and CODESA 13 101Not applicableNo. of flags installed in schools200203Partnership with the Department of Culture, Arts and Traditional Affairs in North West province assisted the department to reach more schools.No. of heritage policies drafted Hosting of one nationalconsultative workshopon the draft repatriationpolicyConsolidation of finalinputs from stakeholdersand preparation of policyfor submission to DPME.National Consultative Workshop on the draft repatriation policy was hosted on 26 September 2019 and inputs from stakeholders consolidated in preparation for submission to DPME.Not applicable

16. Department of Agriculture, Forestry and FisheriesProgramme 1: Administration16IndicatorTarget Q2Output Q2Reason for Deviation Q2Efficient and effective risk managementProgram riskregisterProgram Risk Register has been developedn/aRisk-Based Internal Audit Plan implemented2019/20Q1 reportapprovedby the AuditCommitteeThe 2019/20 Q1 report has been approved by the Audit Committee.n/aInformation and Communication Technology (ICT) Plan implementedTechnicaldesignspecificationcompletedThe Technical Design Specification was not done.The process of working on integrated system has begun.Communication Strategy implementedMedia plansimplemented(NelsonMandela Day,Women’sSummitDAFF, FemaleEntrepreneurAwards,Arbor Week),mediaengagementMedia plans for various activities that were implemented this quarter include tabling of the Budget Vote to the National Council of Provinces in Cape Town by Minister and her Deputy Ministers, Deputy Minister announcement of Arbor City winners, Public consultation workshops on feeds and pet food bill as well as Fertilizer Bill No indication of progress has been indicated on the following media plans:Nelson Mandela Day, Woman’s summit DAFF, and Female Entrepreneur awards.

17. Department of Agriculture, Forestry and FisheriesProgramme 1: Administration17IndicatorTarget Q2Outputs Q2Reason for Deviation Q2Sector information management system strengthenedQuarterly reporton sectoreconomicand statisticalinformationsubmitted toOversightQuarterly report on sector economic and statistical information has been developed  Sector research agenda monitoredAnnual reporton themonitoringof the SectorResearchAgendasubmitted toDEXCOThe annual report on the monitoring of research agenda was submitted to the departmental approval structures.The report has not been approved by DEXCOHRD Strategy implementedApprovedtraining quarterlyreportsubmitted toPSETAThe Q2 2019/20 training report was approved by the Director General (DG) on 27 September 2019 and subsequently submitted to the Public Service Education and Training Authority (PSETA). 324 employees were trained on skills programmes and short courses.n/a

18. Department of Agriculture, Forestry and FisheriesProgramme 1: Administration18IndicatorTarget Q2OutputQ2Reason for Deviation Q2Business Continuity Plans reviewedIndividual coredirectorates’BusinessContinuityPlans ofBranch: ChiefFinancialOfficer (CFO)and Branch:Policy,Planning,Monitoringand Evaluation(PPME) testedAll entire seven core Directorates’ Business Continuity Plans within the Branches PPME (Communications, Statistical & Economic Analysis and Organisation Performance) & CFO (Budget & Reporting, Facilities Management, Financial Accounting and Supply Chain) were concluded.n/aAudit report on Annual Financial Statements (AFS)UnqualifiedAudit Reporton 2018/19financialstatementsQualified Audit report on 2018/19 financial statements.The part of “unqualified” in the target is out of control of the branch and because the objective has not been realised, it is as good as not been done. This is because Material misstatements were noted by the AGSA regarding biological Assets for the Department. Percentage of invoices paid within the 30 days80 %Targets achieved for the invoices paid within the 30 days:• Month of July 94.41 % • Month of August 96.13% • Months September 97.28% n/a

19. Department of Agriculture, Forestry and FisheriesProgramme 1: Administration19IndicatorTarget Q2Output Q2Reason for Deviation Q2Stakeholder Engagement Strategy implemented and reviewed Structured stakeholder engagements coordinatedThe following structured engagements were coordinated: Arbor week held in Port Elizabeth, CEO Steering Committee meeting held at the Imbizo Hall, Harvest House building Arcadia, female Entrepreneur Awards at Grand West Casino, Cape Town, Western Cape Province.Achieved  ICT Disaster Recovery Plan (DRP) reviewedIntranet server replication at DR site Internal Domain Name replication at DR site Assessmentof the cyber security environmentIntranet Replication to Disaster Recovery (DR) site was successfully finalised by second week of August 2019.n/aNumber of project verification reports submitted to EXCOProject quarterly report onverified projects submitted toDEXCOThe report has not been approved by DEXCO.Not provided

20. Department of Agriculture, Forestry and FisheriesProgramme 2: Agricultural Production, Health and Food Safety20IndicatorTarget Q2Outputs Q2Reason for Deviation Q2Number of animal improvement schemes for prioritised value chain commodities implementedMobilisation offarmers anddata collectionfor KyDand poultryschemesFarmers for poultry schemes were mobilised.Mobilisation for KYD was not done.Financial constraints have not been sorted out yet regarding KyD implementationNumber of planned animal diseases risk surveillances conductedManagesurveillanceactions,verify and analysecollectedinformationInformation on surveillance actions was collected,manage, verified, analysed.100% compliance for both animal diseases were not achieved.Number of planned plant pest risk surveillances conductedDocument andanalyse surveillanceresultsDocumented andanalysed surveillanceresults.Not all areas were serviced, not all fruit fly specimens or laboratory results were submitted by DIS before the due date for reporting. Therefore there is a zero report for the Belfast area in Mpumalanga and the Durban area in the Kwa-Zulu Natal province.

21. Department of Agriculture, Forestry and FisheriesProgramme 2: Agricultural Production, Health and Food Safety21IndicatorTarget Q2Output Q2Reason for Deviation Q2Veterinary Strategy implementedStakeholderconsultationsThe “Draft document - Bovine Brucellosis Control Policy, South Africa” was finalised and a submission was sent in April 2019 to allow for publication in the Government Gazette for public comment, however stakeholder consultation could be done.The submission was re-submitted in June 2019, following the appointment of a new Minister for the Department of Agriculture, Land Reform and Rural Development. The submission has been sent to higher structures to approve the draft policy document for publication in the Government Gazette for public comment. Number of targeted taxa conserved Seed characterisedanddocumentedSeed were characterisedand documented.n/aNumber of plant improvement schemes for prioritised value chain commodities monitoredQuarterlyreport on monitoringof seedcrops and fruitcropsQuarterly reporton monitoringof seed crops was compiled.n/a

22. Department of Agriculture, Forestry and FisheriesProgramme 2: Agricultural Production, Health and Food Safety22IndicatorTarget Q2Outputs Q2Reason for Deviation Q2 Number of export protocols for phytosanitary requirements implemented7 exportprotocols forphytosanitaryrequirementsimplemented7 export protocols for phytosanitary requirements is in progressValidation of achievement by M&E is still in progressNumber of Compulsory Community Service (CCS) veterinarians deployedNotificationto applicantson approvedplacementsA notification was sent to applicants for the 2020/2021 CCS programme to inform them of their final approved placement.n/a

23. Department of Agriculture, Forestry and FisheriesProgramme 3: Food Security and Agrarian Reform23IndicatorTarget Q2Output Q2Reason for Deviation Q2Number of reports on national food and nutrition security interventions developedQuarterlyreport onnational foodand nutritionsecurityinterventionsdevelopedThe report has been drafted and in the process of been completedDedicated attention had to be given by management to the World Food preparations and this delayed the finalization of this reportGraduates placed in agriculture, forestry and fisheries sector for capacity development monitoredDraft statusreport on graduatesplacedcompiledThe Draft status report on 255 Graduate placement by DAFF was compiled.The report covers the following: recruitment, selection and placement graduates for the past 5 years.Provincial placement of graduates coordinatedDraft statusreport on graduatesplacedcompiledReport on monitoring of Graduates placed by Provinces for all 9 provinces was compiled There was an over-achievement by 5 provinces due to all provinces willing to accommodate DAFF monitoring visits for the quarter under review.

24. Department of Agriculture, Forestry and FisheriesProgramme 4: Trade Promotion and Market Access24IndicatorTarget Q2Output Q2Reason for Deviation Q2Number of commodity- based cooperatives established3Three(3) commodity -based cooperatives that were established are follows:•Amsterdam Agri-Secondary Cooperative Mpumalanga (Amsterdam) •Amajingqi Agri-business Secondary Cooperative, Eastern Cape (Willowvale •Bhokotho Secondary Cooperative was established in Limpopon/aNumber of cooperatives supported with training3638 cooperatives were supported with FARMTOGETHER trainingn/aTrade agreements implementedQuarterlyprogressreport onthe implementationof tradeagreementsQuarterly progress report on the implementation of trade agreements has been compiled.n/aTrade agreements implementedQuarterlyprogressreport onparticipationin tradenegotiationsQuarterlyprogress report on participation in trade negotiations has been compiled.n/a

25. Department of Agriculture, Forestry and FisheriesProgramme 4: Trade Promotion and Market Access25IndicatorTarget Q2Output Q2Reason for Deviation Q2International relations strategy implementedQuarterly progressreport on strategic engagements of partnerswithin south-south, north-south and multilateralagencies/ forumsQuarterly progress report on strategic engagements of partners within South-South, North-South and multilateral agencies/forums has been compiled.n/aInternational relations strategy implementedQuarterly progressreport on strategicengagement of partners within Africa and AfricaagenciesQuarterly progress report on strategic engagement of partners within Africa and Africa agencies has been compiled.n/aEnabling environment for smallholder access to marketsQuarterly progress reportof SA-GAP CertificationProgramme for producers offresh produce for exportsQuarterly progress report of SA-GAP Certification Programme for producers of fresh produce for exports has been compiled.n/a

26. Department of Agriculture, Forestry and FisheriesProgramme 5: Forestry and Natural Resources Management26IndicatorTarget Q2Output Q2Reason for Deviation Q2Re-commissioning of WC state forest plantationsTransaction advisorappointedThe Bid Specification and Bid Evaluation committee members were appointed on the 16 September 2019.Needs assessment for the appointment of the Transaction Advisor was done and submitted to the Directorate Supply Chain Management on 19 September 2019The transaction advisor has not been appointed and the advert on the tender was not submitted due to the fact that there were delays in the appointment of the transaction advisor because (i) The appointment of the transaction advisor was not included in the procurement plan and inclusion was approved by the CFO on 24 July 2019. Agro-forestry Strategy Framework implementedProject plansdevelopedProject plan has been developed Monitoring of agricultural land rehabilitation interventionsMid-termperformancemonitoringreport on theclimate changeprogrammesdevelopedMid-term performance monitoring report on agricultural land rehabilitation intervention developed 

27. Department of Agriculture, Forestry and FisheriesProgramme 5: Forestry and Natural Resources Management27IndicatorTarget Q2Output Q2Reason for Deviation Q2Number of hectares of state indigenous forests rehabilitated100 ha100.02 ha rehabilitated Climate Smart Agriculture (CSA) Strategic Framework implementedQuarterly report on theimplementation of the CSA Strategic Framework developed ? Climate Smart Agriculture (CSA) Strategic Framework implementedQuarterly report on theimplementation of the CSA Strategic Framework developedQuarterly report on the implementation of the CSA Strategic Framework has been developed Climate Change Adaptation and Mitigation plan (CCAMP) for Agriculture, Forestry And Fisheries implementedAction plan forthe implementationof the CCAMPdevelopedDraft Action plan for the implementation of the CCAMP developed  Climate Change Adaptation and Mitigation plan (CCAMP) for Agriculture, Forestry And Fisheries implementedQuarterly reporton the implementationof the CCAMPQuarterly report on the implementation of the CCAMP has been developed Climate Change Adaptation and Mitigation plan (CCAMP) for Agriculture, Forestry And Fisheries implemented for FY 2019-20-Agriculture, Forestry and FisheriesAction plan for the implementation of the CCAMP  

28. Department of Agriculture, Forestry and FisheriesProgramme 5: Forestry and Natural Resources Management28IndicatorTarget Q2Output Q2Reason for Deviation Q2Number of aquaculture research projects conductedProgress report on economics of newcandidate species foraquaculture conducted (sea urchin)Progress report on economics of new candidate species for aquaculture conducted (sea urchin) has been developed and approved.n/aNumber of aquaculture research projects conductedProgress report on disease preventativemeasuresProgress report on disease preventative measures has been developed and approved.n/aNumber of aquaculture research projects conductedProgress report onmaintenance of monitoring programsProgress report on maintenance of monitoring programs has been developed and approved.n/aCommercial fishing rights allocatedPolicies andapplicationforms reviewedwith internalstakeholdersThe Minister has on 2 August 2019 withdrawn GG Notice No. 637, published in Government Gazette No.41781 on 20 July 2018 relating to the review of the policies of 6 of the 12 fishing sectors with rights that expire in 2020 .All processes has been halted until further notice.

29. Department of Agriculture, Forestry and FisheriesProgramme 6: Fisheries Management29IndicatorTarget Q2Output Q2Reason for Deviation Q2Small-scale Fisheries Policy implementedAllocation ofrights tosmall-scalefisheriescooperatives inKZN45 Cooperatives have been registered with small scale fishers (SSF) of KZN. 36 Co-operatives have been assisted to apply for fishing rights and rights applications have been captured for assessment.Delays in the assessment of rights application forms due to changes in delegations of section 18 of the MLRA. The assessment team was in the process of being appointed by the then delegated authority. Sustainable management of fish stocks Research report to update stock status of West Coast rock lobster and scientific recommendation on catch limits to achieve recovery target was provided on 03 September 2019.Capacity challenges and lack of access to suitable stock assessment analyses limited the quality of the scientific recommendation for abalone. Number of aquaculture catalyst projects (identified and listed under Operation Phakisa) supportedOne OperationPhakisa projectsupportedNo new project supported for the quarter under review.Annual target already exceeded

30. Department of Agriculture, Forestry and FisheriesProgramme 6: Fisheries Management30IndicatorTarget Q2Output Q2Reason for Deviation Q2Number of investigations conducted71A total of 73 investigations conducted. Small-scale aquaculture support programme developedDraft conceptnoteSmall Scale Concept note finalized. Aquaculture Development Act Implementation Plan developedDraft implementationplandevelopedThe draft implementation plan has not been developed due the Aquaculture Bill not having undergone parliamentary processes or being "passed.The Parliamentary scheduling process is beyond the control of the Department.

31. Department of Basic EducationProgramme 1: Administration31IndicatorTarget Q2Output Q2Reason for Deviation Q21.1.1. Percentage of valid invoices paid within 30 days upon receipt by the Department.100 %99.8 %Project Managers did not sign off invoice on time

32. Department of Basic EducationProgramme 2: Curriculum Policy, Support and Monitoring32IndicatorTarget Q2Output Q2Reason for Deviation Q2Number of training sessions of CAPS for Technical subjects monitored22No deviationNumber of Technical Schools monitored for implementation of CAPS.66No deviationNumber of schools with multi-grade classes monitored for implementing the Multi-Grade Toolkit1818No deviationNumber of advocacy campaigns conducted on the Rural Education Framework in the provinces24To mitigate the -2-deficit incurred in Quarter 1Number of learners obtaining subject passes towards a National Senior Certificate (NSC) or extended Senior Certificate, including upgraded NSC per year1500037482More learners registered for the programme due to increased publicity

33. Department of Basic EducationProgramme 3: Teachers, Education Human Resources and Institutional Development33IndicatorTarget Q2Output Q2Reason for Deviation Q2Number of EFAL diagnostic analysis reports produced11No deviationNumber of Physical Science diagnostic analysis reports produced11No deviationNumber of Accounting diagnostic analysis reports produced11No deviationNumber of Mathematics diagnostic analysis reports produced11No deviationNumber of PEDs monitored on the implementation of IQMS23Additional province monitored in lieu of Quarter 3 which will be utilised for developing training resources on the QMS.Number of PEDs monitored on the implementation of PMDS33Monitoring of additional province was re-scheduled from Quarter 1

34. Department of Basic EducationProgramme 4: Planning, Information and Assessment34IndicatorTarget Q2Output Q2Reason for Deviation Q2Number of new schools built and completed through ASIDI56Most of the projects have been in implementation for a long time as a result the Implementing Agents have managed to complete more than it was planned. As the targets were based on the previous trends, i.e the number of projects that the Implementing Agents were able to complete in a year.Number of schools provided with sanitation facilities through ASIDI14720The set target could not be met due to poor performing contractors appointed by The Mvula Trust in the Eastern Cape and the Limpopo Provinces. Number of schools provided with water through ASIDI.2514The set target could not be met due to poor performing contractors appointed by The Mvula Trust in the Eastern Cape and the Limpopo Provinces.

35. Department of Basic EducationProgramme 5: Educational Enrichment Services35IndicatorTarget Q2Output Q2Reason for Deviation Q2Number of schools monitored for the provision of nutritious meals5033Cancelled monitoring visitsNumber of schools monitored for the provision of nutritious meals5033Cancelled monitoring visitsNumber of learners, teachers, officials, SGBs, parents and community organisation members participating in social cohesion and gender equity programmes.25003438The Directorate hosted two Jamboree instead of 1 Jamboree. The Jamboree was hosted in Cape Town, Bonteheuwel to expose learners with life skills and various career opportunities Number of Hot Spot Schools monitored towards implementation of the NSSF.1220Provinces arranged for 20 Districts to be monitored. The 20 schools came from the 20 Districts.

36. Department of Cooperative Governance and Traditional Affairs Programme 1: Administration36IndicatorTarget Q2Output Q2Reason for Deviation Q2Percentage implementation of the post-audit action plan to improve audit outcomesNo target N/A

37. Department of Cooperative Governance and Traditional Affairs Programme 2: Regional and Urban Development and Legislative Support37IndicatorTarget Q2Output Q2Reason for Deviation Q2IUDF strategy and implementation programme for small town regeneration approved by Director-General and implementedDraft IUDF strategyand implementationprogramme for thesmall town regenerationpresented at MinMEC by30 September 2019 Draft IUDF strategyand implementationprogramme for thesmall town regenerationpresented at MinMEC by30 September 2019 The target to develop the Draft Integrated Urban Development Framework (IUDF) strategy and implementation programme for the small town regeneration was not presented at MinMEC by 30 September 2019 as planned. This is due to the need to change the Terms of Reference (TOR) deliverable timeframe from 5 months to 9 months. Integrated planning and coordinating model for the 44 Districts Municipalities and 8 Metropolitan municipalities approved by the MinisteConcept document onthe Integrated planningand coordinatingmodel for the 44Districts Municipalitiesand 8 Metropolitanmunicipalities developedby 30 September 2019Concept document onthe Integrated planningand coordinatingmodel for the 44Districts Municipalitiesand 8 Metropolitanmunicipalities developedby 30 September 2019N/AIntegrated Township Economic Development Programme approved by the Director-General and implementedResearch reportreflecting proposals ondeveloping townshipeconomies developed by30 September 2019Research reportreflecting proposals ondeveloping townshipeconomies developed by30 September 2019N/A

38. Department of Cooperative Governance and Traditional Affairs Programme 3: Institutional Development38IndicatorTarget Q2Output Q2Reason for Deviation Q2A municipal-specific revenue plan implemented in selected municipalities to increase revenue base, revenue collection rates and payment of creditorsA municipal-specific revenue planimplemented in 35 municipalities in line with the municipal specific project plans, to increase revenuebase, revenue collection rates and payment of creditors by 30 Sept 2019Draft IUDF strategy and implementation programme for the small town regeneration presented at MinMEC by 30 September 2019Prince Albert LM requested the implementation of project to be deferred to November 2019 as they were busy with auditing and utilizing the same resources for both auditing and revenue related aspect.Number of municipalities assessed in terms of compliance with the rating aspects of the MPRACollection of information on therating practices and compliance withregulations on rates in respect of 71municipalities by 30 September 2019Draft IUDF strategy and implementation programme for the small town regeneration presented at MinMEC by 30 September 2019N/ANumber of municipalities supported to have functional ward committees 28 municipalities supported to have functional ward committees by 30 September 201928 municipalities supported to have functional ward committees by 30 September 2019N/ANumber of District Municipalities/Metros where training on local government anti-corruption strategy is rolled outTraining on local government anticorruption strategy rolled out in 4 district municipalities/metros by 30 September 2019Training on local government anticorruption strategy rolled out in 4 district municipalities/metros by 30 September 2019N/A

39. Department of Cooperative Governance and Traditional Affairs Programme 3: Institutional Development39IndicatorTarget Q2Output Q2Reason for Deviation Q2Municipal Systems Amendment Bill introduced to ParliamentSupport Parliamentduring stakeholderengagement by 30September 2019 Stakeholderengagement in Parliament scheduleed for 23 and 29 October 2019

40. Department of Cooperative Governance and Traditional Affairs Programme 4: National Disaster Management Centre40IndicatorTarget Q2Output Q2Reason for Deviation Q2Number of municipalities assessed on the capacity to implement the National Fire Safety and Prevention StrategyCapacity assessment on the capacity to implement the National Fire Safety and Prevention Strategy conducted in 4 municipalities by 30 September 2019Capacity assessment on the capacity to implement theNational Fire Safety and Prevention Strategy conducted in 4 municipalities by 30 September 2019N/ANumber of disaster management priority guidelines approved by the Head of NDMCFirst drafts of 2 Priority Guidelines developed by 30 September 2019First drafts of 2 PriorityGuidelines developed by30 September 2019N/ANumber of integrated advocacy and awareness programmes successfully held in partnership with municipalities to promote and advance for Disaster Risk Reduction2 integrated advocacy and awarenessprogrammes successfully held in partnership with municipalities to promote and advance for Disaster Risk Reduction by 30 September 2019 2 integrated advocacy and awareness programmes successfully held in partnership with municipalitiesto promote and advance for Disaster Risk Reduction by 30 September 2019N/A

41. Department of Cooperative Governance and Traditional Affairs Programme 5: Local Government Support and Interventions Management41IndicatorTarget Q2Output Q2Reason for Deviation Q2Number of municipalities supported on MIG spending for infrastructure development183 municipalitiessupported onMIG spendingfor infrastructuredevelopment by 30September 2019 183 municipalitiessupported onMIG spendingfor infrastructuredevelopment by 30September 2019N/A

42. Department of Cooperative Governance and Traditional Affairs Programme 6: Community Work Programme42IndicatorTarget Q2Output Q2Reason for Deviation Q2Number of work opportunities provided to CWP participants247 466 workopportunities provided to CWP participants by 30 September 2019247 466 workopportunities providedto CWP participantsby 30 September 2019A variance of 19,792 has been recorded, and this is due to savings accrued as a result of participants’ absenteeism and attrition rate. Enabling that CWP enrol more participants than planned.Number of CWP participants trained8 248 CWP participants trained by 30 September 20198 248 CWPparticipants trained by30 September 2019Requests for quote issued however the awards of trainers were incomplete due to low supplier efficiency. Delays in conducting skills audit. Gauteng volatile with riots and go slows delaying SCM processes.Number of partnerships established2 partnershipsestablished by 30September 20192 partnershipsestablished by 30September 2019LGSETA being a potential partner have cancelled meetings arranged with them twice.

43. Department of Correctional ServicesProgramme 1: Administration43IndicatorTarget Q2Output Q2Reason for Deviation Q24.1.3.1. Percentage of officials charged and found guilty of corrupt activities 95100Target achieved due to evaluation of cases that were conducted in preparation for the hearings4.1.3.2. Percentage of Integrated communication and marketing strategy implemented 5050None4.2.2.1. Number of officials trained in line with the Workplace Skills Plan (WSP)14 12017380Demand for training exceeded the planned target4.2.2.2. Percentage of management areas where Integrated Employee Health and Wellness (IEHW) programme is rolled out.138.33Roll-out postponed during quarter one due to conflicting priorities 4.4.3.1. Number of sites where Integrated Inmate Management System (IIMS) is rolled out307Corrections of identified issues delayed beyond estimated timelines4.4.3.2. Percentage of correctional facilities and community corrections offices where Local Area Network (LAN) Infrastructure is rolled out38.138.06None4.5.2.1. Percentage of Correctional facilities and PPP’s facilities inspected on the conditions and treatment of inmates 3029.63Underachievement was due to inadequate capacity

44. Department of Correctional ServicesProgramme 2: Incarceration44IndicatorTarget Q1Outputs Q1Target Q2Output Q2Reason for Deviation Q25.1.3.1. Percentage of inmates who escape from correctional centres and remand detention facilities per year 0.0090.0050.0170.009Target achieved due to the implementation of escape prevention plan5.1.3.2 . Percentage of inmates injured as a result of reported assaults in correctional centres and remand detention facilities per year1.180.852.351.68Target achieved due to the continuous monitoring of security policies5.3.2.1. Percentage of RDs’ in Remand Detention Facilities (RDFs) subjected to Continuous Risk Assessment (CRA).6067.736068.48More officials were trained to roll-out CRA in the previous financial year and this increased the percentage of RDs in the Remand Detention facilities. 5.4.3.1Percentage of overcrowding in correctional centres and remand detention facilities in excess of approved capacity4033.944036.48The number of inmates were lower than anticipated 5.4.3.2. Percentage of offender’s profiles submitted by the Case Management Committees (CMCs) that were considered by CSPBs9289.869294.41Appointments of the CSPB members led to timeous consideration of profiles

45. Department of Correctional ServicesProgramme 3: Rehabilitation45IndicatorTarget Q2Output Q2Reason for Deviation Q26.1.2.1. Percentage of sentenced offenders subjected to correctional programmes per year4047.12Interim Correctional Intervention officials (CIOs) were available to facilitate correctional programmes6.2.3.1. Percentage of offenders participating in skills development programmes measured against the number of offenders enrolled per financial year. (Long Skills Training)8099.18Target achieved through support and partnership with external stakeholders such as SASSETA, ServicesSetaand MerSeta6.2.3.1. Percentage of offenders participating in skills development programmes measured against the number of offenders enrolled per financial year. (Short Skills Training)8099.70Involvement of external stakeholders contributed to increased participation6.2.3.1. Percentage of offenders participating in skills development programmes measured against the number of offenders enrolled per financial year. (TVET)8098.55Involvement of external stakeholders contributed to increased participation6.2.3.2. Number of offenders who participate in educational programmes per the Daily Attendance Register per academic year (AET)1052710629Recruitment of more learners for formal education programmes led to the achievement of the target6.2.3.2. Number of offenders who participate in educational programmes per the Daily Attendance Register per academic year (FET)7181009Increased stakeholder involvement led to over-achievement of the target6.3.3.1. Percentage of incarcerated offenders, probationers and parolees who are involved in Social Work services per year 2633.78Target achieved due to effective marketing of social work services to offenders, parolees and probationers

46. Department of Correctional ServicesProgramme 4: Care46IndicatorTarget Q2Output Q2Reason for Deviation Q27.1.2.1. Percentage of inmates on Anti-Retroviral Therapy (ART)9098.95Continuous compliance in the implementation of UTT Guidelines, follow-up on awaiting initiations and continuous counselling on those that refuses treatment 7.1.2.2. TB (New pulmonary) cure rate of offenders.8991.45Target achieved due to continuous monitoring of offenders on TB treatment7.2.2.1. Percentage of therapeutic diets prescribed for inmates125.76Target achieved due to effective review of diet

47. Department of Correctional ServicesProgramme 5: Social Reintegration47IndicatorTarget Q2Output Q2Reason for Deviation Q28.1.2.1. Percentage of parolees without violations per year 9798.96Target achieved due to effective supervision and monitoring of parolees 8.1.2.2. Percentage of probationers without violations per year 9798.94Target achieved due to effective supervision and monitoring of probationers8.2.3.1. Number of victims /offended who participate in Restorative Justice programme378012501Fund received from CARA contributed in the achievement of the target8.2.3.2. Number of Offenders/Parolees and Probationers who participated in Restorative Justice programme35004055Roadshows conducted to Regions has brought positive impact towards participation of offenders in the programme

48. Department of Human SettlementsProgramme 1: Administration48IndicatorTarget Q2Q2 OuputsReason for Deviation Q21.1.1 Percentage compliance with statutory tabling and prescripts 100% compliance with statutory tabling and prescripts 83% compliance with statutory tabling and prescriptsThe revised DPME framework requires the Departments to submit only one draft Strategic Plan and Annual Performance Plan on the 31st of October of each year. ENE was incorrectly captured in the Technical Indicator Description1.1.2 Percentage implementation of the approved internal audit plan 45% implementation of the approved internal audit plan 15% implementation of the approved internal audit planDelay due to expansion of audit work supporting theMonitoring & Evaluation unit in verification of delivery figure and finalisation appointment of service provider from the panel1.1.3 Percentage Implementation of the approved risk management plan 65% implementation of the approved risk management plan 58% implementation of the approved risk management planThe BarnOwl is dependent on the completion of migration process from Novel to Microsoft which is underway1.1.4 Percentage execution of the approved anti-fraud and corruption implementation plan 100% execution of the approved anti-fraud and corruption Implementation plan 100% execution of the approved anti-fraud and corruption implementation planNot applicable

49. Department of Human SettlementsProgramme 1: Administration49IndicatorTarget Q2Q2 OutputsReason for Deviation Q21.1.5 Percentage implementation of the Annual Human Resource Implementation Plan 100% implementation of the Annual Human Resource implementation Plan 77% implementation of the Annual Human Resource Implementation PlanReduction of vacancy rate: Post approvals to advertise and fill 74 posts, processes commenced to advertise, including drafting of Adverts and verification against Job Descriptions and Placement in DPSA Circular and National Media the approvals to advertised Provide reason for deviationRevision and Alignment of Organisational Structure1.1.6 Percentage of Lodged disputes investigated within 90 days100% of lodged disputes investigated within 90 days100% of lodged disputes investigated within 90 daysNot applicable 2.1.1 Number of reports on the development of legislative framework as per approved Legislative Programme1 report on the development of legislative framework as per approved Legislative Programme 1 report on the development of legislative framework as per approved Legislative ProgrammeNot applicable

50. Department of Human SettlementsProgramme 1: Administration50IndicatorTarget Q2Q2 OuputsReason for Deviation Q23.1.1 Percentage availability of the HSS Database Systems90% availability of HSS Database Systems98% availability of HSS Database SystemsThe average availability for the quarter for all the systems was 98%. Maintenance was conducted as required timeously.3.1.2 Percentage availability of secured ICT services90% availability of secured ICT services 91% availability of secured ICT servicesThe average availability maintained for the fourth quarter for both IT Infrastructure is 91%

51. Department of Human SettlementsProgramme 1: Administration51IndicatorTarget Q2Q2 OutputsReason for Deviation Q21.1.3 Number of intergovernmental forums coordinated for human settlements development8 intergovernmental forums coordinated for human settlements development8 intergovernmental forums coordinated for human settlements development, that is,-Intergovernmental performance and review sessions,-Expanded Public Works Programme (EPWP)-Back to Basics-Student accommodation-Participation and collaboration with the Department of Science and Technology-Joint Coordinating Committee on land on unlawful land occupation-FOSAD-Visit by the Portfolio Committee to Hammanskraal and Vaal Water TreatmentNot applicable

52. Department of Human SettlementsProgramme 1: Administration52IndicatorTarget Q2Q2 OuputsReason for Deviation Q21.1.4 Number of stakeholder partnerships mobilised towards Human Settlements development 4 stakeholder partnerships mobilized towards human settlements development3 stakeholder partnerships mobilised towards human settlements development1. Rapid inter-spherical responses to stakeholders petitions - Ministerial outreach initiatives Reports on stakeholder/community engagements 2. Structured stakeholder forums to contribute towards human settlements policy and legislative development3. Sponsorship from social contract signatoriesGovan Mbeki awards were deferred by the Minister to 2020/2021 financial year1.1.5 Number of initiatives on international cooperation aligned to human settlement priorities supported 6 initiatives on international cooperation aligned to Human Settlement priorities supported6 initiatives on international cooperation aligned to Human Settlement priorities supportedNot applicable 2.1.1 2019-2024 MTSF DevelopedStakeholder consultation on the draft 2019-2024 MTSFConsultation Workshop held on the draft 2019 - 2024 MTSF developedNot applicable

53. Department of Human SettlementsProgramme 3: Programme Monitoring and Delivery53IndicatorTarget Q2Q2 OutputsReason for Deviation Q21.1.1Project Readiness Matrix implemented in a number of provincesReport on project readiness of projects in 9 provinces in line with approved provincial business plansReport on project readiness of projects in 9 provinces in line with approved provincial business plansNot applicable1.1.2 Programme implementation support provided to number of government-led catalytic projectsProgramme implementation support provided to 50 government-led catalytic projectsProgramme implementation support provided to 50 government-led catalytic projectsNot applicable1.1.3 Programme implementation support for the revitalization of distressed mining communities in a number of Local Municipalities providedProgramme implementation support for the revitalization of distressed mining communities in 23 Local Municipalities provided Programme implementation support provided to 23 municipalities with distressed mining communitiesNot applicable1.1.4 Number of Informal Settlements assessed (Feasibility Study conducted)50 Informal Settlements assessed (Feasibility Studies conducted)42 Informal Settlements assessed (Feasibility Studies conducted)in Emakhazeni (6), Victor Khanye (13), Mbombela (4), Mkhondo (13) and Nkomazi (6).8 Informal Settlements not assessed (Feasibility Studies conducted) due to unrest in Mpumalanga Ehlanzeni and Gert Sibande Districts

54. Department of Human SettlementsProgramme 3: Programme Monitoring and Delivery54IndicatorTarget Q2Q2 OutputsReason for Deviation Q21.1.5 Number of Informal Settlement Upgrading Plans developed100 Informal Settlement Upgrading Plans developed40 Informal Settlements Upgrading Plans developed in Mahikeng (4), Ramotshere Moiloa (8) and Msukalingwa (28).60 Informal Settlements Upgrading Plans not developed due to the unrest in Mpumalanga Ehlanzeni and Gert Sibande Districts1.1.6 Number of households in provinces and metros supported on the upgrading of informal settlementsSupport provided to provinces and metros for the upgrading of 19 580 households in informal settlementsSupport provided to provinces and metros for the upgrading of 3 468 households in informal settlements: EC: 344, FS: 0, GP: 1,075, LP: 407, MP: 40, NC: 0, NW: 835, WC: 767 and Total for all Provinces (HSDG figures)Provinces and Metros were further supported with the preparation of UISP Grant Partnership Business PlansFigures for USDG will only be available by mid October 2019

55. Department of Human SettlementsProgramme 3: Programme Monitoring and Delivery55IndicatorTarget Q2Q2 OutputsReason for Deviation Q21.1.7 Provinces and municipalities supported to provide a number of individual units for subsidy housing marketProvinces and municipalities supported to provide 18 612 individual units for subsidy housing marketProvinces and municipalities supported to provide individual units for subsidy housing marketNo delivery figures Report with delivery figures will only be available by end of October 2019 1.1.8 Support provided to deliver a number of Private Affordable Rental Housing unitsSupport provided to deliver 1000 Private Affordable Rental Housing unitsSupport was not fully provided to deliver Private Affordable units No delivery figures Report with delivery figures will only be available by end of October 2019 from the NHFC1.1.9 Support provided on the implementation of Social Housing programme to deliver a number of unitsSupport provided on the implementation of Social Housing programme to deliver 750 unitsSupport provided on the implementation of Social Housing unitsNo delivery figures Report with delivery figures will only be available by end of October 2019 from the SHRA1.1.10 Support provided on the implementation of Community Residential Unit (CRU) Programme to deliver a number of unitsSupport provided on the implementation of Community Residential Unit (CRU) Programme to deliver 100 unitsSupport provided on the implementation of Community Residential Unit (CRU) Programme No delivery figures Report with delivery figures will only be available by end of October 2019 from the SHRA

56. Department of Human SettlementsProgramme 3: Programme Monitoring and Delivery56IndicatorTarget Q2Q2 OuputsReason for Deviation Q21.1.11 Number of Provinces supported to deliver multiyear land assembly targetsSupport provided to provinces to deliver the multiyear land assembly targetsSupport provided to provinces on multiyear land assembly Awaiting further evidence from the Housing Development Agency (HDA) in respect of the delivery figures1.1.12 Support provided to Provincial Departments towards the registration of a number of pre and post 94 title deedsSupport provided to Provincial Departments towards the registration of 13 000 pre and post 94 title deedsSupport provided to Provincial departments towards the registration of 1941 pre 1994 and 8829 post 1994 title deeds Final quarter 2 figures will only be available by end of October 20191.1.13 Provinces supported in the implementation of Title Deeds programme (from April 2014) to deliver a number of Title DeedsProvinces supported in the implementation of Title Deeds programme(from April 2014) to deliver 23 000 Title DeedsProvinces supported in the implementation of Title Deeds programme(from April 2014) No delivery figuresFigures will only be available by end of October 20191.1.14 Provinces supported to deliver a number of housing opportunities to Military VeteransSupported in the delivery of 200 housing opportunities to Military Veterans Supporte9 provinces d in the delivery of 10 housing opportunities to Military Veterans, that is, Mpumalanga (2) and Limpopo (8) The Department of Military Veterans struggled to provide beneficiary lists on time, which resulted in Provinces not meeting their targets.

57. Department of Human SettlementsProgramme 3: Programme Monitoring and Delivery57IndicatorTarget Q2Q2 OuputsReason for Deviation Q21.1.15 Number of provinces and metros supported in the implementation of PHP policy5 Provinces and 4 Metros supported in the implementation of PHP Policy8 Provinces (MP,NW,KZN, FS,EC, WC, GP and NC) and 5 Metros (Ethekwini, CoJ, COCT, NMBM, BCM) were supported in the implementation of PHP PolicyThe support was part of the preparatory work for packaging of potential projects and capacitation of stakeholders (communities and officials) 2.1.2 Human Settlements Sector capacity development Strategy developedHuman Settlements Sector Consulted on the 1st draft of Human Settlements Sector capacity development strategyThe Human Settlements Sector was consulted on the 1st draft Human Settlements Sector capacity development strategyNot applicable 3.1.1 Percentage of projects under implementation monitored and verified (HSDG and USDG)100% of projects under implementation monitored and verified (HSDG and USDG)100% of projects under implementation monitored and verified (HSDG and USDG)Not applicable

58. Department of Human SettlementsProgramme 3: Programme Monitoring and Delivery58IndicatorTarget Q2Q2 OutputsReason for Deviation Q23.1.2 Number of evaluation studies completedA conceptual framework developed for: UISP 3 year impactInception report on the evaluation study for:UISP 3 year impact Rapid Appraisal of Outcome 8The Impact of the Housing Chapters of the Integrated Development Plan (IDP)A conceptual framework developed for:• UISP 3 year impact Inception reports developed for the following studies: • UISP 3 year impact • Rapid Appraisal of Outcome 8 *The Impact of the Housing Chapters of the Integrated Development Plan (IDP).Not applicable 1.1.1 Number of HSDG quarterly performance assessments conducted1 HSDG quarterly performance assessments conducted1 HSDG quarterly performance assessments conducted Not applicable1.1.2 Number of Title Deeds Restoration Grant (TDRG) quarterly performance assessments conducted1 TDRG quarterly performance assessments conducted1 TDRG quarterly performance assessments conductedNot applicable

59. Department of Human SettlementsProgramme 4: Housing Development Finance59IndicatorTarget Q2Q2 OuputsReason for Deviation Q21.1.3 Number of USDG quarterly performance assessments conducted1 USDG quarterly performance assessments conducted1 USDG quarterly performance assessments conductedNot applicable1.1.4 Number of assessments on the performance of Finance Linked Individual Subsidy (FLISP) conducted1 quarterly performance assessment of FLISP conducted1 quarterly performance assessment of FLISP conductedNot applicable1.1.5 Number of assessments on the volume of loans granted by DFIs for the affordable housing market conducted1 quarterly assessment on the volume of loans granted by DFIs for the affordable housing market conducted1 quarterly assessment on the volume of loans granted by DFIs for the affordable housing market conductedNot applicable1.1.6 Number of assessments of employers’ contribution towards Employer Assisted Housing conducted1 assessments of employers’ contribution towards Employer Assisted Housing conductedAssessment report on the employers' contributions towards employer assisted housingNot applicable

60. Department of Human SettlementsProgramme 4: Housing Development Finance60IndicatorTarget Q2Q2 OuputsReason for Deviation Q21.1.7 Finance and funding model to better target the realisation of Human Settlements outcomes revisedReport on the status of the current finance and funding model A report on the status of the current finance and funding model Not applicable 1.1.9 Number of performance assessments on the Office of Disclosure1 performance assessment on the Office of DisclosurePerformance Assessment on the office of disclosure.Not applicable Percentage of approved invoices paid within 30 days100 %Supply Chain Management is experiencing capacity constraints SCM to assign additional resources to deal with processing backlogsNumber of SADC structures and processes supported with substance and logistics to promote peace and stability, socio-economic development, good governance and democracy and regional integration3One additional achievement - Q1 target achieved in Q2 

61. Department of International Relations and CooperationProgramme 2: International Relations61IndicatorTarget Q2Q2 OutputsReason for Deviation Q2Number of structured bilateral mechanisms and high-level engagements facilitated to promote national priorities, the African Agenda and the Agenda of the South (SM)4Seven Structured Bilateral Mechanisms held to promote National Priorities, the African Agenda and the Agenda of the South with particular focus on:• regional and global issues;• bilateral, economic and cultural cooperation;• commercial relations;• trade and investment opportunities;• education and research;• agriculture;• defence;• transport;• waiver of visas for diplomatic and official passports; and• finalisation of outstanding Memoranda of Understanding. Q1 targets achieved in Q2

62. Department of International Relations and CooperationProgramme 2: International Cooperation62IndicatorTarget Q2Q2 OutputsReason for Deviation Q2Number of multilateral structures and processes engaged in to strengthen outcomes to meet the needs of South Africa, Africa and developing countries3Prepared for and participated in a Session of the Human Rights Council from 24 June to 14 July 2019, Geneva. Council considered and adopted 26 resolutions on a wide range of thematic issues and country specific issues. South Africa supported 21 resolutions, either by voting in support or joining consensus and abstained on 5 country specific resolutions.Number of high-level meetings of organisations of the South engaged in to contribute to and advance common positions of the South, aligned to South Africa's Foreign Policy positions1Prepared for and participated in the Mid – Year Coordination Session of the AU Executive Council from 4 to 8 July 2019, Niamey. • The Session approved the AU Budget for 2020;• The Session approved the theme for 2020;• Committee on implementation of Agenda 2063 was revitalized;• The Session endorsed the African Candidatures;• The Session launched an operational phase for African Continental Free Trade Agreement (AfCFTA)

63. Department of International Relations and CooperationProgramme 4: Public Diplomacy, State protocol and Consular Services63IndicatorTarget Q2Q2 OutputsReason for Deviation Q2Number of platforms utilised to inform and promote South Africa’s foreign policy to domestic and international audiences (PPPs)3Six Public Participation Programmes (PPP’s) were held by political principals where audiences were engaged on domestic and international developments, as well as Foreign PolicyAdditional events in response to issues in domestic environmentPercentage of protocol services rendered during state visits and international conferences100% (14) of protocol services rendered during state visitsOutgoing 7Incoming 7No requests received for international conferences during the reporting period --

64. Department of Minerals and ResourcesProgramme1: Administration64IndicatorTarget Q2Q2 OuputsReason for Deviation Q2Number of mining career awareness initiatives - HRD 88 % of system availability95 %99.71 % % of reduction in occupational fatalities20 %27 %The reason for over achievement is due inspections, audits, ohs imbizos or campaigns, ohs tripartite satakeholder workshops, health and safety reps workshops and engagements with mine management and executives that are focussing on strategies to combat fatalities.IndicatorTarget Q2Q2 OuputsReason for Deviation Q2Number of SLPs development projects completed6047 Programme 3: Minerals Regulations

65. Department of Minerals and ResourcesProgramme 4: Mineral Policy and Promotion65IndicatorTarget Q2Q2 OutputsReason for Deviation Q2Number of publications 77

66. Department of Military VeteransProgramme 1: Administration66IndicatorTarget Q2Q2 OutputsReason for Deviation Q2Percentage of approved Communication Strategy activities implemented100 %60 %Website not fully functional. Non functionality of Call Centre System.Delays with publication procurement processes. IndicatorTarget Q2Q2 OutputsReason for Deviation Q2Number of military veterans with access to healthcare services1750017691Healthcare is in high demandProgramme 2: Socio – Economic Support

67. Department of CommunicationsProgramme 1: Administration67IndicatorTarget Q2Q2 OuputsReason for Deviation Q2HRD Strategy implemented-N/AN/APercentage of compliant invoices paid within 30 days100 %100 %NoneNumber of Strategic Risk mitigation reports compiled11NoneProgramme 2: Communications Policy, Research and DevelopmentIndicatorTarget Q2Q2 OuputsReason for Deviation Q2Audio-Visual and Digital Content Strategy implementedResearch report onaudio-visual issues forthe 4IRResearch report onaudio-visual issues forthe 4IR was producedNone

68. Department of CommunicationsProgramme 3: Industry and Capacity Development68IndicatorTarget Q2Q2 OutputsReason for Deviation Q2Analogue Transmission Services Switched-Off in all provinces by 2021Reviewed BDM delivery model submitted to CabinetReviewed BDMdelivery model was notsubmitted to Cabinet.Reviewed BDMdelivery model was undergoing further consultation.Audio-Visual SMME Programme focusing on 4IR skills and Enterprise Development implementedFacilitation of theimplementation of the Audio-Visual SMME Programmecommenced and progressreport developedThe facilitation of the implementation of the Audio Visual SMME Programme report is still in a draft format report.Appropriate approval process of a report is being followed to actually finalize the report Number of RSA Positions developed jointly with DTPS4th ATU WRC 19preparatory meetinghostedThe 4th ATU WRC 19preparatory meeting washosted in East London, South Africa from 26-30 August 2019 which culminated the adoption of the African Common Proposals for WRC-19 amongst others.None

69. Department of CommunicationsProgramme 4: Entity Oversight69IndicatorTarget Q2Q2 OuputsReason for Deviation Q2Number of performance review and compliance monitoring reports of SOEs developed33None

70. Department of DefenceProgramme 1: Administration70IndicatorTarget Q2Q2 OutputsReason for Deviation Q2Percentage of written complaints finalised within the Office of the Military Ombud37.50%43.54%284 complaints were brought forward from Q1 while 86 new complaints were received during Q2, resultingin a total caseload of 370.79 Complaints were finalised during Q2 with a subsequent caseload of 291.Percentage compliance with submission dates of DOD accountability documents (Reports on RFC activities submitted to the Executive Authority)50%(1) (Report on RFC Activitiessubmitted to the ExecutiveAuthority)50% (1) (Report on RFC Activities submitted to the Executive Authority)None. Q2 target achieved.Status of external statutory responses to requests received100%100% (0)No requests were received from Chapter 9 Institutions during Q2.Percentage compliance with submission dates of DOD accountability documents (SANDF quarterly reports submitted to the Executive Authority)25%(1)25% (1)None. Q2 target achieved.Percentage compliance with submission dates of DOD accountability documents (Percentage compliance with DOD financial management products)28%(10)24% (9)The Accounting Officer was unable to submit the DOD Annual Report for FY2018/19 (including theAudited Financial Statements) to NT in terms of Sec 40(1)(d) of the PFMA, 1999, by 31 Aug 2019.

71. Department of DefenceProgramme 1: Administration71IndicatorTarget Q2Q2 OuputsReason for Deviation Q2Percentage of disciplinary cases in the DOD finalised within 90 days (PSAP Disciplinary Cases)100%11% (2 out of 18)The complexity of some cases required more time for finalisation. Inadequate structure and lack ofpersonnel to be used as Chairperson’s and Departmental representatives for finalisation of casescontributed to the under achievement of the set target.Percentage compliance with SANDF Battle fitness requirementsInformationclassifiedInformation classifiedNone.Number of Strategic Activities per annum40No scheduled visits were undertaken during Q2. Internal commitments had prevalence over scheduled visits.Number of Covenantal relationships with Religious stakeholders (Religious Advisory Boards)11None. Q2 target achieved.Number of marketing events to promote the Reserves96Planned marketing and promotion activities had to be cancelled in order to remain within budget.

72. Department of DefenceProgramme3: Landward Defence (Reporting to C SANDF)72IndicatorTarget Q2Q2 OutputsReason for Deviation Q2Percentage compliance with DOD training targets17.77%(552)46.49% (1 444)None. Q2 target achieved.Percentage compliance with DOD training targets20.06%(172)38.13% (327)None. Q2 target achieved.

73. Department of DefenceProgramme 5: Maritime Defence (Reporting to C SANDF)73IndicatorTarget Q2Q2 OutputsReason for Deviation Q2Percentage compliance with DOD training targets43%(235)1.28% (7)All learners who have completed the 2019 Maritime Training for Ratings Part 1 Programme must still befound competent iro the Basic Water Orientation and Nuclear, Biological, Chemical and Damage Control(NBCD) modules. Deviation is due to the ongoing renovation of the NBCD School and unserviceability ofthe SAS SALDANHA swimming pool.

74. Department of DefenceProgramme 7: Defence Intelligence (Reporting to the C SANDF)74IndicatorTarget Q2Q2 OutputsReason for Deviation Q2Number of Defence Intelligence products112169None. Q2 target achieved.IndicatorTarget Q2Q2 OuputsReason for Deviation Q2Percentage of modernised, sustainable DOD ICT Integrated Prime Systems Capabilities19.03%22.96%None. Q2 target achieved.Projected number of deliberate crime prevention operations3143None. Q2 target achieved.Programme 8: General Support

75. Department of EnergyProgramme : Clean Energy75IndicatorTarget Q2Q2 OuputsReason for Deviation Q2Number of Energy savings realized and verified for EEDSM projects 0.50.5 Number of quarterly reports on vacancy rate of less than / equals to 15% 15 %15 %No vacancies have been filled IndicatorTarget Q2Q2 OuputsReason for Deviation Q2Percentage of approved invoices from service providers paid within 30 days of receipt100100 Programme : Financial Management Services

76. Department of EnergyProgramme :Nuclear Energy76IndicatorTarget Q2Q2 OutputsReason for Deviation Q2Draft Decommissioning and Decontamination policy Draft D&D Policypublished for publiccommentsNot Achieved Position Paper aimed at obtaining inputs from the public was finalised in October 2019. The project on development of costing methodology is in progress, and a briefing session has been held on 15 Oct 2019. The delays are due to SCM processes wherein the new SCM framework was still being established.IndicatorTarget Q2Q2 OutputsReason for Deviation Q2Number of quarterly progress report which detail the implementation of the 2014-19 MTSF Outcomes 4,6,7,8,9 and 10 submitted to Cluster 1 Quarterly Progresswhich detail theimplementation ofthe 2014–2019 MTSFOutcomes 4, 6, 7, 8,9 and 10 signed bythe DoE Minister (Q1)2019/20Target discontinued Programme :Office of the Director - General

77. Department of HealthProgramme 1 :Administration77IndicatorTarget Q2Q2 OutputsReason for Deviation Q2Claim management system implemented to contain costs and streamline its managementClaim management system pilotedThe use of Case Management System by provincial Departments of Health has been approved. In addition, approval has been granted for investigation of suspicious medico-legal claims.Vetting of the recommended service provider was required

78. Department of HealthProgramme 2 : National Health Insurance78IndicatorTarget Q2Q2 OutputsReason for Deviation Q2Number of patients enrolled for receiving medicines through the centralised chronic medicine dispensing & distribution (CCMDD) programme2,675,000 patientsenrolled for receivingmedicines throughthe CCMDDprogramme(cumulative)3,038,215 patients enrolled for receiving medicines through the CCMDD programmeThe programme is performing well due to increased demand from the patientsLegislation for NHINHI Bill adoptedby CabinetOn 10 July 2019 Cabinet approved therevised National Health Insurance Bill to betabled in ParliamentNot applicableNumber of health facilities implementing health patient registration system (HPRS)3220 PHC facilitiesand 29 Hospitalsmaintained;Additional8 hospitalsimplementing theHPRS3043 PHC Facilities maintained; additional 5 PHC Facilities and 6 Hospitals implementing HPRSMajor Challenges with supply chain for the purchasing of the Hardware

79. Department of HealthProgramme 3 :Communication and Non Communication Diseases79IndicatorTarget Q2Q2 OutputsReason for Deviation Q2EPI surveillance external review recommendations implemented2 provincial training workshops conducted2 provincial workshops conducted in North West and Eastern CapeNot applicableProvincial Malaria Elimination Implementation Plans developed1 Provincial EliminationImplementation PlanDeveloped1 provincial elimination implementation plan developedNot applicableMedical Male Circumcisions performed4400003495695 months (April -August) data is available on DHIS Number of patients receiving radiation oncology1700 patientsreceivingradiationoncology0Contract entered into with the service provider was cancelled which delayed implementation. The award of this tender needed to be concluded on or before 24 December 2018 for the bid validity to still be in force.

80. Department of HealthProgramme3 :Communication and Non Communication Diseases80IndicatorTarget Q2Q2 OutputsReason for Deviation Q2Number of undiagnosed TB infected persons (new cases) found3000029662The data reported are only for July and August 2019Number of regional hospitals implementing the quality Improvement Programme for pregnant women and neonates4 regional hospitalsvisited, and QualityImprovement Plans (QIPs) developed; QIPs of 6regional hospitalsimplemented6 regional hospitals were visited and QIPs developed, 6 regional hospitals have started with implementation of the QIPs.The two additional hospitals were identified as part of the Themba hospital QIPs due to the referral system.

81. Department of HealthProgramme 4 :Primary Health Care81IndicatorTarget Q2Q2 OutputsReason for Deviation Q2Number of Districts supported to be compliant with the minimum requirements of the District Health Management Office (DHMO) structure guidelinesplans developed for an additional 10 districtsImprovement plans submitted for 11 districtsKZN DoH focused on development of improvement plans for all 11 district in the provinceIdeal EMS framework developedDraft Ideal EMS Framework presented to NCEMS and other key stakeholdersDraft Ideal EMS Framework presented to NCEMS and other key stakeholdersNot applicableEnvironmental health legislation reviewedLiterature reviewLiterature review conductedNot applicableNational Guideline on conducting Patient Experience of Care SurveyStakeholders consulted on the revised Patient Experience of Careguidelines Revised guidelines on conductingPatient Experience of Care Survey piloted in 10 clinicsStakeholders consulted on the revised Patient Experience of Care guidelines Delayed consultation and approval processes

82. Department of HealthProgramme 5 :Hospital Systems82IndicatorTarget Q2Q2 OutputsReason for Deviation Q2Number of regional and tertiary hospitals assessed using the Ideal Hospital Framework22 Regional and9 TertiaryHospitalsassessed(cumulative)16 Regional and 6 Tertiary hospitals assessed.The provincial DoHs have not been actively assessing the hospitals.

83. Department of HealthProgramme 6 :Health System Governance and Human Resources 83IndicatorTarget Q2Q2 OutputsReason for Deviation Q2Percentage backlog for blood alcohol tests eliminated50% backlog eliminated for bloodalcohol tests90.17% backlog eliminated for blood alcohol testNot applicableeHealth Strategy 2020 – 2025 publishedeHealth Strategy 2020-2025 furtherconsultations held and incorporatedThe National Digital Health Strategy was finalised and approved. Not applicableNational Human Resources for Health (HRH) Strategy 2020- 2030 publishedUpdated draft HRH strategy presentedto key management and governancestructures of the health sectorDraft chapters of the HRH Strategy presented at various forums - namely Tech NHC, NHC and HRH Stakeholders IndabaNot applicableNumber of nursing colleges accredited to offer the new qualification programmes5 Nursing colleges supported andevaluated against the HigherEducation accreditation tool todetermine state of readiness5 Nursing Colleges supported and evaluated against the Higher Education accreditation tool to determine state of readinessNot applicableLegal framework to establish National Public Health Institute of South Africa (NAPHISA)Not ApplicableNot ApplicableNot Applicable

84. Department of Justice and Constitutional DevelopmentProgramme1: Administration84IndicatorTarget Q2Q2 OutputsReason for Deviation Q21.1 Percentage of significant findings on key specific areas resolved0 %0 % IndicatorTarget Q2Q2 OutputsReason for Deviation Q24.1 Percentage of criminal cases postponed due to unavailability of court administration staff0.3 %0.2 % Programme2: Court Services

85. Department of Justice and Constitutional DevelopmentProgramme 3: State Legal Services85IndicatorTarget Q2Q2 OutputsReason for Deviation Q210.1 Percentage of letters of appointment issued in deceased estates within 15 days from receipt of all required documents92 %93 % IndicatorTarget Q2Q2 OutputsReason for Deviation Q219.1 Conviction rate in complex commercial crimes93 %94.9 %The total number of cases finalised with a guilty verdict (including Sect 57 A), increased in relation to the number of cases finalised with a verdictProgramme 4: National Prosecuting Authority

86. Department of Justice and Constitutional DevelopmentProgramme 5: Auxiliary and Associated Services86IndicatorTarget Q2Q2 OutputsReason for Deviation Q222.1 Number of government departments and entities exchanging information electronically88 

87. Department of LabourProgramme 2: Inspection and Enforcement Services87IndicatorTarget Q2Q2 OutputsReason for Deviation Q21.1 Number of employers inspected per year to determine compliance with employment law110346112186The over achievement is due to a concerted effort by the provinces to make up for the under achievement from Q1.

88. Department of LabourProgramme 3: Public Employment Services88IndicatorTarget Q2Q2 OutputsReason for Deviation Q21.1 Number of work-seekers registered on Employment Services of South Africa1750002528031. High unemployment levels in the country2. Number of advocacy campaigns conducted

89. Department of Environmental AffairsProgramme 1 : Administration89IndicatorTarget Q2Q2 OutputsReason for Deviation Q2External audit opinion1)Implementation and improvement of internalcontrol (Financial Management, Risk Management andOrganisational Performance Management)2) External audit report/opinion issued by AGSA • Turn-around strategy to address all Financial Management and Performance Information audit findings developed • Control measures to mitigate performance information risk implemented and review on a continuous basis.• Performance information verified quarterly by Management and reviewed by Internal Audit.

90. Department of Environmental AffairsProgramme 2 : Legal, Authorisation, Compliance and Enforcement90IndicatorTarget Q2Q2 OutputsReason for Deviation Q2Percentage of administrative enforcement instructions compiled withAdministrative enforcement instructionsmonitored54% of the instructions that were issued were complied with. (79 instructions issued, 43 were complied with and 36 were not complied with)The level of compliance has dropped significantly at this stage the overall compliance for this financial year is standing at 61,96%, the variance being 13,04%.

91. Department of Environmental AffairsProgramme 3 : Oceans and Coasts91IndicatorTarget Q2Q2 OutputsReason for Deviation Q2National Coastal Management Programme interventions implementedNational Stakeholder Workshop to review firsthotspot analysis draft report conductedNational Stakeholder Workshop held on 30 September 2019 to review the Draft report. IndicatorTarget Q2Q2 OutputsReason for Deviation Q2National Framework for Climate Services developed and implemented 2 Climate Service Products developedTwo climate services products have been developed, namely:• Revised State of the Climate Report and; • World Meteorological Organisation extreme indices Programme 4 : Climate Change, Air Quality and Sustainable Development

92. Department of Environmental AffairsProgramme 5 : Biodiversity and Conservation92IndicatorTarget Q2Q2 OutputsReason for Deviation Q2Percentage of land under conservationSANParks expansion plan evaluatedSANParks expansion Plan evaluated IndicatorTarget Q2Q2 OutputsReason for Deviation Q2Number of Full Time Equivalents (FTEs) created8 9716 268 Full Time Equivalents (FTEs) createdDelayed start of project implementation due to approval of agreements. Programme 6 : Environmental Programmes

93. Department of Environmental AffairsProgramme 7 : Chemical and Waste Management93IndicatorTarget Q2Q2 OutputsReason for Deviation Q2Number of chemicals and waste management instruments developed and implemented (Mercury Management National Action Plan for the Minamata Convention finalised)Cost benefit analysis finalisedCost benefits analysis finalised 

94. Economic DevelopmentProgramme 2 : Growth Path and Social Dialogue94IndicatorTarget Q2Q2 OutputsReason for Deviation Q2KPI 2: Number of analytical and public policy advocacy reports on socio-economic development and the NGP produced12Product for Q1 2019/20 delivered in this quarterIndicatorTarget Q2Q2 OutputsReason for Deviation Q2KPI 8: Number of quarterly Cabinet-level progress reports of infrastructure Strategic Intergrated Projects (SIPs)1618Reports compiled on demandProgramme 3 : Investment, Competition and Trade

95. Department of Home AffairsProgramme 1: Administration95IndicatorTarget Q2Preliminary Q2Reason for Deviation Q2NIS development in respect of: Publication of Request for Proposal Evaluation for accredited bidders completed2nd release of systems specification submitted to DHA in July 2019 Change of Procurement Model.Number of ports with biometric functionality piloted as per signed business requirements of pilotIT equipment procuredEquipment procured has been delivered and barcoded. Invoice has been submitted to finance for payment.N/ANumber of missions equipped with e-Permit systemProcurement of IT equipment finalisedEquipment procured has been delivered and barcoded. Invoice has been submitted to finance for payment.N/ANumber of managers (junior, middle and senior) trained in leadership and management development programmes to improve performance and professionalisation150156N/A. Within the 4% over/under achievement range Approval of revised DHA Access Model by Minister’s Management Meeting (MMM)Accessibility Information Survey to collect spatial data on target population, DHA service points and road network conducted by service provider (Report)Achieved. Questionnaire developed and variables of interest agreed upon.Data collection application designed and tested in selected offices.All 412 Front offices visited and spatial information, including office information pertaining to staff compliment, ICT infrastructure, services rendered, functionality of computers, signage, access to offices, etc. as well as office pictures. Spatial data collected in currently being edited and prepared for Accessibility modeling which will be conducted during the 3rd quarter.N/A

96. Department of Home AffairsProgramme 2: Citizen Affairs96IndicatorTarget Q2Preliminary Q2Reason for Deviation Q2Number of smart ID cards issued to citizens 16 years of age and above750000735308Due to system instability, errors, and slowness at back office (BVR) a potential production of 159 335 were lost in respect of the set norms and standards for individualsIn addition to the above, there was water outage from the 2 to 10 September 2019 at BVR and all back office staff were released during these days. During the 2-10 September a potential production of 87 641 were lost in respect of the set norms and standards for individualsFurthermore the system instability and water and power challenges at BVR resulted in 32 513 cases which could not be finalised on time, as at 30th September 2019.The system down time in provinces resulted in 6 682 hours and 72 017 application loss resulting in lower volumes of issued Smart ID Cards. This demonstrates that the system availability and stability is currently not functioning at 100% which impacts on the attainment of the Smart Card target.Number of births registered within 30 days 206661218739Continuous monitoring of birth registration through daily reports with provincesA total of 3 890 births were registered during quarter 2 over weekends and holidays. This was as a result of officials volunteering to work over weekends and public holidays

97. Department of Home AffairsProgramme 2: Citizen Affairs97IndicatorTarget Q2Preliminary Q2Reason for Deviation Q2Percentage (%) of machine readable passports (new live capture system) for adults issued within 13 working days for applications completed and processed within the RSA (from branch process complete date until passport is scanned at office of application)90 %99.30 %The releases during April resulted in system instability which was escalated and prioritized. After the management interventions and daily fixes, the system became more stable and positively affected passports productionThere is an improvement on turnaround times on applications at image enhancement section after the process was enhanced to ensure applications older than 5 days are prioritized and dealt withContinuous sourcing of additional staff from Smart Card to the Passport Distribution Centre (PDC)The list creation and dispatch system had ample downtime during the review period and impacted on the dispatching of passports. Ongoing interactions with stakeholders during the review period has brought gradual improvements to system issues but are not entirely resolved despite improvements.

98. Department of Home AffairsProgramme 3: Immigration Affairs98IndicatorTarget Q2Preliminary Q2Reason for Deviation Q2Submission of draft Immigration Bill (including Refugee amendments) to Minister for approvalConsultation with 2 FOSAD Clusters (JCPS and G&A Clusters)Not Achieved Reasons for over/none achievementConsultation could only be undertaken with DEVCOM on 22 August 2019 and the JCPS Cluster on 3 September 2019. The G&A Cluster will only be consulted in the 3rd Quarter due to delays in finalising internal consultations on the Draft Immigration Bill and consolidation of inputs into the Draft Bill.Although the ICTS Cluster consultation is scheduled for the 3rd Quarter, consultation with the ICTS Cluster Working Session (GCAC) was undertaken on 19 September 2019 due availability of the Committee.

99. Department of Home AffairsProgramme 3: Immigration Affairs99IndicatorTarget Q2Preliminary Q2Reason for Deviation Q2Number of law enforcement operations / inspections conducted to ensure compliance with immigration and departmental legislation4056Reasons for over/none achievementThe target was exceeded as there were increased inspections of freight companies in order to minimize the employment of foreign truck drivers which was cited as a reason for increased attacks against foreign truck drivers. Government wants to assure those who feel aggrieved by foreign truck drivers to allow government to deal with the issue.Following xenophobic attacks a determination to minimize reasons for communities to engage in anti foreign sentiment and to reassert authority of state on crime combatting measures the inspectorate is far more operational and will reach targets.

100. Department of Home AffairsProgramme 3: Immigration Affairs100IndicatorTarget Q2Preliminary Q2Reason for Deviation Q2Submission of a business case for the establishment of a National Targeting Centre (NTC) for ministerial approvalNTC benchmarking study finalisedNot achieved.A service provider to assist with the development of the NTC Business Case has not been appointed.A service provider has not been appointed to assist with the development of the NTC Business Case.The terms of reference was advertised on 16 August 2019 with a bid closing date of 6 September 2019. The Bid Evaluation Committee could not convene a meeting earlier than 27 September 2019 due to the unavailability of members.

101. Department of Home AffairsProgramme 3: Immigration Affairs101IndicatorTarget Q2Preliminary Q2Reason for Deviation Q2Percentage (%) of permanent residence applications adjudicated within 8 months for applications collected within the RSA (from date of receipt of application until outcome is in scan at VFS Centre – office of application) (Above applications refer to: cri85 %91.3 %(1 974 out of 2 161) permanent residence applications adjudicated within 8 months for applications collected within the RSA (from date of receipt of application until outcome is in scan at VFS Centre – office of application) There is separation of the population ofcritical applications that are maturing in the following quarter. These applications are processed by a separate team of officials whose responsibility is to deal with critical applications (APP applications). The results of this plan is that applications are finalized one quarter ahead to ensure that the Unit achieves the target with ease.

102. Department of Home AffairsProgramme 3: Immigration Affairs102IndicatorTarget Q2Preliminary Q2Reason for Deviation Q2Percentage (%) of business and general work visas adjudicated within 8 weeks for applications processed within the RSA (from date of receipt of application until outcome is in scan at VFS Centre - office of application)90 %98.6 %(432 out of 438) of business and general work visas adjudicated within 8 weeks for applications processed within the RSA (from date of receipt of application until outcome is in scan at VFS Centre - office of application).There is a dedicated team that work on Business and General Work visas only. The team receive applications daily and management monitors performance of the team on a daily basis.Percentage (%) of critical skills visas adjudicated within 4 weeks for applications processed within the RSA (from date of receipt of application until outcome is in scan at VFS Centre - office of application)85 %86 %(1 105 out of 1 285)of critical skills visas adjudicated within 4 weeks for applications processed within the RSA (from date of receipt of application until outcome is in scan at VFS Centre - office of application).There is a dedicated team that work on Critical Skills visas only. The team receive applications daily and management monitors performance of the team on a daily basis. Management performs reconciliation of applications received online with a Report from VFS. The report from VFS is reconciled with the VAS report from DHA IS to ensure that discrepancies are corrected without delays. This is a major contributor to the high performance rate achieved this quarter. Establishment of Border Management Authority (BMA) as per BMA Road Map , subject to enactment of BMA legislationNoneN/AN/A

103. Department of Home AffairsProgramme 3: Immigration Affairs103IndicatorTarget Q2Preliminary Q2Reason for Deviation Q2Percentage (%) of permanent residence applications adjudicated within 8 months for applications collected within the RSA (from date of receipt of application until outcome is in scan at VFS Centre – office of application) (Above applications refer to: cri85 %91.3 %(1 974 out of 2 161) permanent residence applications adjudicated within 8 months for applications collected within the RSA (from date of receipt of application until outcome is in scan at VFS Centre – office of application) There is separation of the population ofcritical applications that are maturing in the following quarter. These applications are processed by a separate team of officials whose responsibility is to deal with critical applications (APP applications). The results of this plan is that applications are finalized one quarter ahead to ensure that the Unit achieves the target with ease. Percentage (%) of business and general work visas adjudicated within 8 weeks for applications processed within the RSA (from date of receipt of application until outcome is in scan at VFS Centre - office of application)90 %98.6 %(432 out of 438) of business and general work visas adjudicated within 8 weeks for applications processed within the RSA (from date of receipt of application until outcome is in scan at VFS Centre - office of application).There is a dedicated team that work on Business and General Work visas only. The team receive applications daily and management monitors performance of the team on a daily basis.

104. Department of Home AffairsProgramme 3: Immigration Affairs104IndicatorTarget Q2Preliminary Q2Reason for Deviation Q2Percentage (%) of critical skills visas adjudicated within 4 weeks for applications processed within the RSA (from date of receipt of application until outcome is in scan at VFS Centre - office of application)85 %86 %(1 105 out of 1 285)of critical skills visas adjudicated within 4 weeks for applications processed within the RSA (from date of receipt of application until outcome is in scan at VFS Centre - office of application).There is a dedicated team that work on Critical Skills visas only. The team receive applications daily and management monitors performance of the team on a daily basis. Management performs reconciliation of applications received online with a Report from VFS. The report from VFS is reconciled with the VAS report from DHA IS to ensure that discrepancies are corrected without delays. This is a major contributor to the high performance rate achieved this quarter. Establishment of Border Management Authority (BMA) as per BMA Road Map , subject to enactment of BMA legislationNoneN/AN/A

105. Programme 2: Planning, Policy and Strategy105Department of Higher EducationIndicatorTarget Q2Preliminary Q2Reason for Deviation Q26.2.1.2.1 Policy framework on Gender- Based Violence in the PSET system gazettedPubliccomments ondraft Gender-BasedViolencepolicyconsolidatedTarget achievedPublic comment on draft Gender-Based Violence policy were consolidatedNoneProgramme 3: University Education – No target for the quarter

106. Programme 4: Technical and Vocational Education and Training106Department of Higher EducationIndicatorTarget Q2Preliminary Q2Reason for Deviation Q26.4.1.1.1 Percentage of TVET Colleges compliant to approved financial governance standards65 %70 %Colleges complied to the approved financial governance standards6.4.1.1.2 Percentage of TVET maintenance expenditure achieved in terms of approved infrastructure maintenance plans50 %18 %Approval of the report was delayed6.4.1.1.4 Percentage of Public TVET College examination centres conducting national examinations and assessments in compliance with national policy100 %100 %None6.4.1.1.5 Period it takes to issue certificates to qualifying candidates following publication of results (months)33None6.4.1.3.1 Number of monitoring and evaluation reports on the performance of TVET colleges approvedProgress report on the reduction of certification backlog developed and approved by the Director-General by 30 September 2019Progress report on the reduction of certification backlog was developed and approved by the Director General on 02 October 2019Approval of the report was delayed

107. Programme 5: Skills Development107Department of Higher EducationIndicatorTarget Q2Preliminary Q2Reason for Deviation Q26.5.1.1.1 Average lead time from qualifying trade test applications received until trade test is conducted (days)6032None6.5.1.1.2 Percentage of national artisan learners trade test pass rate (including INDLELA)65 %56 %The reported achievement is preliminary6.5.1.1.3 Number of new artisan learners registered100003115The reported achievement is preliminary6.5.1.1.4 Number of new artisan learners qualified per annum5500949The reported achievement is preliminary, and the final validated report against the target will be provided in the 3rd quarter6.5.1.2.1 Number of SETAs monitoring reports approved per annum11NoneProgramme 6: Community College Education and Training – No target for the quarter

108. Government Communication and Information SystemProgramme 1 : Administration108IndicatorTarget Q2Q2 OutputsReason for Deviation Q2APP tabled in Parliament within prescribed regulationsFirst draft 2020-2023APP submitted toNational Treasuryand the DPME as alegislative requirement The first draft APP is due to be submitted to DPME on 31 October 2019 The revised Framework for Strategic and Annual Performance Plans require departments to submit the Draft 2020-2023 APP by 31 October 2019

109. Government Communication and Information SystemProgramme 1 : Administration109IndicatorTarget Q2Q2 OutputsReason for Deviation Q2MTEF HRP implemented No TargetNo targetNone Number of reports on IM&T governance implemented (Availability of IT Infrastructure)One report on theavailability of ITinfrastructure presentedto the IM&T SCThe 2019-20 first quarter report on IT Infrastructure Availability was presented to the IM&T Steering Committee on 19 July 2019 None Annual financial statements (AFS) issued within legislative prescripts First quarter 2019/20interim financialreporting compiled andsubmitted to NationalTreasuryThe first quarter 2019/20 interim financial reporting was compiled and submitted to National Treasury on 31 July 2019. NoneNumber of progress reports on assurance audits producedOne progress reporton performance,compliance, financialaudit conductedThe progress report on performance, compliance, financial audits conducted was developed. None

110. Government Communication and Information SystemProgramme 2 : Content Processing and Dissemination110IndicatorTarget Q2Q2 OutputsReason for Deviation Q2Number of editions of PSM magazine published annuallyThree editions of PSM magazine publishedThree editions of the PSM magazine were published. NoneNumber of cluster reports on perceptions of government priorities producedNo targetNo targetNone

111. Government Communication and Information SystemProgramme 3: Intergovernmental Coordination and Stakeholder M111IndicatorTarget Q2Q2 OutputsReason for Deviation Q2Number of engagements between government officials and senior journalists on the PoA held Six engagementsbetween governmentofficials and seniorjournalists on thegovernment PoA heldEight engagements were held between government officials and senior journalists. Additional engagements were required for projects from other departments Number of engagements with Heads of Communications (HoCs) heldOne engagement withHoCs heldOne engagements with HoCs was held NoneNumber of reports on support to the functioning of government communication system produced (provincial and local level)One report on supportto the functioningof governmentcommunication systemproduced (provincialand local level)One report on support to the functioning of government communication system was producedNone

112. Department of Traditional AffairsProgramme 1: Administration112Cooperative Governance and Traditional AffairsIndicatorTarget Q2Output Q2Reason for Deviation Q2% of actions in the Organisational Performance Information Compliance Management Plan implemented100% of actions in the organizational performance information ComplianceManagement Plan for the quarter implementedAchieved100% of actions in the organisational performance information Compliance management Plan for the quarter was implementedN/A% of actions in the Corporate and Financial Management (CFM ) Compliance Management Plan implemented100% of actions in the CFM ComplianceManagementPlan for the quarterimplementedNot Achieved 100% of actions in the CFM Compliance Management Plan for the quarter were not implementedThe Chief Directorate had 14 Quarterly targets in the Compliance Management Plan. All targets, with exception of Payroll Certification were achieved. Out of 51 Payroll certificates for the quarter, only one was not returned to Finance on time in compliance with Treasury Regulations 8.3.

113. Department of Traditional AffairsProgramme 2: Research, Policy and Legislation113Cooperative Governance and Traditional AffairsIndicatorTarget Q2Output Q2Reason for Deviation Q2Approved Information Management Framework for the institution of traditional leadershipConsultation onthe Draft IMFconductedAchieved A Provincial workshop was convened to consult with on the IMF on 13 September 2019. Furthermore, consultation on the draft IMF conducted re the NHTL, TATGoF and MANCO were consulted on the draft IMF in September 2019.N/ANumber of books on kingships customary laws of succession and genealogies developedData collectionfor thecustomary law ofsuccession andgenealogyAchievedData was collected for the customary law of succession and genealogy of AmaZulu KingshipN/A

114. Department of Traditional AffairsProgramme 3: Institutional Support and Coordination114Cooperative Governance and Traditional AffairsIndicatorTarget Q2Output Q2Reason for Deviation Q2Number of PHTLs monitored on the involvement of Traditional Leaders in agrarian revolution3 PHTLs monitored on theinvolvement of TraditionalLeaders in agrarian revolutionAchievedLimpopo House of Traditional Leaders monitored under Hlaneki Traditional Community the Thuthani Farm in Giyani. The project is well developed and operational. Free State House of Traditional Leaders reported that they have one community agricultural project established by the traditional Council. The project is well underway.Northern Cape House of Traditional Leaders reported that Kgosana Setlhodi from Ba ga Jantjie tribal office handed over 2 hectors of land to the newly established agricultural cooperatives which consists of 30 women community members. The site erected 5 tunnels and is well fenced.N/ANumber of kings and queens engagements convened1 kings and queensengagement convenedAchievedThe NHTL held a meeting with King Zwelonke Sigawu at Nelspruit.N/ANumber of provinces monitored on the implementation of the Guidelines on the participation of traditional leadership in the municipal IDP processes3 Provinces monitored onthe implementation of theguidelines on participationof traditional leadership inthe municipal IDP processesConducted workshops in three provinces on the Process flow and Monitoring Tool designed to support provinces on the implementation of the Guidelines on participation of traditional leadership in municipal IDP processes.N/A

115. Department of Traditional AffairsProgramme 3: Institutional Support and Coordination115Cooperative Governance and Traditional AffairsIndicatorTarget Q2Output Q2Reason for Deviation Q2Number of provinces workshopped on the Cooperative Governance Framework for Traditional Leadership3 Provincesworkshoppedon theCooperativeGovernanceFrameworkfor TraditionalleadershipConducted workshops on the draft Cooperative Governance Framework for inputs and comments as follows: >The National House of Traditional Leaders on 9 July 2019; >The North West Provincial House on 15-16 August 2019;>The Mpumalanga Traditional Leaders and Officials on 28-29 August 2019;>The Limpopo Provincial House of Traditional Leaders and Traditional Affairs and Local Government Officials on 4 and 5 September 2019.>The National House of Traditional Leaders on 9 September 2019; and>The Ehlanzeni Councilors and Traditional Leaders on 10 and 11 September 2019.Consolidated the comments obtained from the engagements with the three provinces as well as with the other stakeholders and updated the comments template accordingly.N/A

116. Department of Traditional AffairsProgramme 3: Institutional Support and Coordination116Cooperative Governance and Traditional AffairsIndicatorTarget Q2Output Q2Reason for Deviation Q2Approved guidelines for the provisioning and maintenance of infrastructure for structures of Traditional leadershipConsultationon thedraft withstakeholdersconducted•Draft Guidelines for the provisioning and maintenance of physical infrastructure for Traditional leadership were presented at COGTA technical Minmec in July 2019 and in the meeting between DTA and DARLR in September 2019.•A consultation report has been developed.N/AApproved Proposed curriculum for traditional leadershipConsultationon the DraftProposedcurriculumfor traditionalleadershipconductedThe Department of Traditional Affairs and the Eastern Cape Cooperative Governance and Traditional Affairs met with the Nelson Mandela University (NMU) on August 2019 to present the proposed leadership and governance programme and framework on the proposed curriculum for traditional leadership in Port ElizabethN/A

117. Programme 1: Administration117Planning, Monitoring and EvaluationIndicatorTarget Q2Output Q2Reason for Deviation Q2Approved Strategic and Annual Performance PlansReview and produce 1stdraft of strategic plan andAPP and submit to NT andDPMENot Achieved1st draft of strategic plan and APP was not submitted to NT and DPMEThe Revised Framework for Strategic Plans and Annual Performance Plans requires that Departments submit their 1st draft by 31 October 2019Quarterly implementation reports against APP1 (2019/2020Quarter 1)Achieved1st quarter implementation report was produced-Audited Annual ReportAudited Annual Reportsubmitted to NationalTreasury and Parliamentby due dateAchieved Audited Annual Report wassubmitted to NationalTreasury by due date and tabled in Parliamentby 27 September 2019 (due date was 30 September 2019) Quarterly Reporting on Internal Audit Annual Plan to Audit Committee2nd Quarterly InternalAudit reportsubmitted to Audit CommitteeAchievedQuarterly Internal Audit Report produced and tabled at the AC meeting held on 26 July 2019-

118. Programme 1: Administration118Planning, Monitoring and EvaluationIndicatorTarget Q2Output Q2Reason for Deviation Q2Annual communication plan and Percentage achievement of targets in the Communication PlanImplement 40% of activitiesand produce quarterlyreportAchieved108% of Activities in the Interim Communication Operational Plan were conducted (54/50*100=108%)Quarter 2 Report Submitted68% target exceededPercentage of funded posts filled10% or less onaverage over thequarterNot Achieved Average vacancy rate for the quarter was 11%1% of deviation HR Plan implementation reportsHR Plan reviewed andreport producedAchieved HR Plan was reviewed and a report was produced-Percentage achievement of targets in the ICT Plan1 report showing80% of targets achievementAchieved1 ICT Plan Report showing 81% of targets achievement (13/15*100=87%) Percentage of valid invoices paid within 30 days and cases where noncompliance leads to disciplinary action100% of valid invoices paid within 30 days or disciplinary action taken in 100% of cases where invoices are not paid within 30 daysAchievedAchieve 100% of valid invoices paid within 30 days-Number of quarterly progress reports on Risk, Anti- Corruption and Integrity Management implementation plan produced1AchievedQuarterly risk, anti-corruption and integrity management implementation plan produced-

119. Programme 2: Institutionalising National Planning in Government119Planning, Monitoring and EvaluationIndicatorTarget Q2Output Q2Reason for Deviation Q2Number of research reports initiated in support of the implementation of the NDP1Not AchievedA report on research projects to review and support implementation of the NDP was not producedAchievedReport on stakeholder engagement completed.1 progress report deviationNumber of stakeholder engagement reports1 engagement reportAchievedReport on stakeholder engagement completed.-Number of NPC Plenaries3AchievedThree plenaries meetings were held in Quarter 2-

120. Programme 2: Institutionalising National Planning in Government120Planning, Monitoring and EvaluationIndicatorTarget Q2Output Q2Reason for Deviation Q2Number of reports and partnerships on the implementation of regional (SADC:RISDP), continental (Agenda 2063) and international (SDGs) engagements---NDP 5-Year Implementation Plan approvedNDP 5-YearImplementation Plansubmitted to CabinetNot AchievedNDP 5-YearImplementation Planwas not submitted to CabinetNDP 5-YearImplementation Plan not submittedNumber of consultation sessions on the NSDF3Not Achieved 2 engagements on the NSDF were conducted1 engagement deviation from the planned target

121. Programme 3: Sector Monitoring & Programme 4: Public Sector Monitoring and Capacity Development 121Planning, Monitoring and EvaluationIndicatorTarget Q2Output Q2Reason for Deviation Q2Number of Operation Phakisa reports encompassing progress of delivery labs1Achieved Integrated assessmentreports on theimplementation of theOperation Phakisa DeliveryLabs was produced by 30 September 2019.-Number of progress reports on the Special Presidential Package on Mining towns and labour sending areas1Not Achieved Progress Reports on the SpecialPresidential Package on Mining towns and labour sending areas was not producedProgress Reports on the SpecialPresidential Package on Mining towns and labour sending areas was not producedNumber of analytical reports on 30-day payments produced1 analysis reportAchievedAnalysis report on30-day payments was produced-Percentage of targets in the PM&E Capacity Development Plan achieved40% of targetsachievedAchieved40% of targets achieved16/34*85% (Annual Percentage) = 40%-

122. Programme 5: Evaluation, Evidence and Knowledge System122Planning, Monitoring and EvaluationIndicatorTarget Q2Output Q2Reason for Deviation Q2National Evaluation Plan producedDraft policy and planproducedAchieved Draft National Evaluation Policy Framework and National Evaluation Plan was Produced-Monitoring report on the implementation of improvement plans on evaluations completedDraft reportAchieved Draft monitoring report on the implementationof improvement plans was produced.-Progress report on the implementation of the NEP producedDraft reportAchieved Draft progress report on the implementation of the NEP was produced.-

123. Programme 5: Evaluation, Evidence and Knowledge System123Planning, Monitoring and EvaluationIndicatorTarget Q2Output Q2Reason for Deviation Q2Number of research assignments completed2Achieved 2 research assignments were completed-Functional Knowledge Management System (KMS)Revised Knowledge HubBusiness Plan producedAchieved Revised KnowledgeHub Business Plan was produced-Development Indicators report producedStakeholder workshopsconductedAchievedDevelopment Indicators 2018 stakeholders workshop was conducted-Number of Data analysis reports produced2Achieved12 data analysis assignments undertaken10 more analysis reports were undertaken

124. Programme 1: Administration & Programme 2: SOC Governance & Performance124Public EnterprisesIndicatorTarget Q2Output Q2Reason for Deviation Q2Number of training interventions in line with WPS55NoneNumber of SOC quarterly financial reviews and reports produced77NoneNumber of consolidated progress reports on SOCs audit findings11NoneBoard performance evaluation framework developedConduct gap analysis of existing board evaluation toolsAchievedNonePercentage of anti-fraud and corruption hotline incidents reports forwarded to the relevant authorities80 %0 %Three incidents were reported.Progress report memo not approved by ADG as additional information is required.Develop SOC Risk integrity management framework Draft SOC risk reporting norms and standardssNot achievedThe procurement strategy was changed as the department is of the view that the project can be delivered at a reasonable cost than quotations received during the competitive bidding process.

125. Programme 3: Business Enhancement and Industrialisation125Public EnterprisesIndicatorTarget Q2Output Q2Reason for Deviation Q2Monitoring reports on SOCs contribution to the development of scarce and critical skills producedQ1 201920 SOC quarterly reports producedAchievedNoneMonitoring of SOCs CSI programmes11NoneReport on social impact assessment of SOCs CSI programmesProgress report on the social impact assessment of SOCs CSI programmesNot achievedTOR were re-submitted for approval and were subsequently advertised on 16 September 2019 for bidding. Closing date is 14 October 2019.Monitor implementation of the localisation strategic frameworkAssessment of SOCs quarterly reports on the implementation of the localisation strategic frameworkNot achieved Contract terminated as DPE was not satisfied with the last two phases of the project with termination decision communicated to Service Provider and agreed to by all parties

126. Programme 3: Business Enhancement and Industrialisation126Public EnterprisesIndicatorTarget Q2Output Q2Reason for Deviation Q2Develop Environmental Implementation Plan (EIP) for DPEDraft EIP submitted to DEA for commentsAchievedNoneReview report on performance of Eskom's fleet produced10Engagement on the performance of Eskom's fleet not providedReport on the implementation of Eskom's turnaround plan10During the planning cycle the unit did not anticipate the development of the Special Paper which will cover the detailed implementation plan for separation of EskomReport on the implementation of Alexkor's proposed shareholding optimal structure10appointment of an administrator in the place of the Alexkor's board not the implementation of Alexkor's proposed shareholding optimal structure.Number of progress reports on the delivery of Eskom Build Programme (Medupi, Kusile and Power Delivery Projects)11NoneAssessment report on the electricity generation reserve margin to evaluate whether 19% is sustainedOne assessment report on the electricity generation reserve margin to evaluate whether 19% is sustained0No Monthly and quarterly system status report

127. Programme 3: Business Enhancement and Industrialisation127Public EnterprisesIndicatorTarget Q2Output Q2Reason for Deviation Q2Socio-economic impact assessment reports on SOCs selected capital projects completedReview report of Eskom's capital projectsNot achievedEngagement with SOC to ensure development of localisation strategies/plans towards compliance to localisation requirementsReport on the implementation of the restruturing plan for Denel11NoneAssess increase in tonnage moved on rail to 330mtpa by 2019Assess increase in tonnage moved on rail to 235 mtpa by 2019AchievedNone

128. Programme 3: Business Enhancement and Industrialisation128Public EnterprisesIndicatorTarget Q2Output Q2Reason for Deviation Q2Report on implementation of SAA and SA Express turnaround plansReport on implementation of SAA and SA Express turnaround plans including any proposed remedial actions completed Not achievedDelay in submitting the final report Assess improvement of operational performance of sea ports and inland terminals from 28 to 35 average GCM/H by 2019 Assess improvement of operational performance of sea ports and inland terminals from 28 to 35 average GCM/H by 2019AchievedNone

129. Programme 1: Administration129Public Service and AdministrationIndicatorTarget Q2Output Q2Reason for Deviation Q21. Proper financial management in line with the Public Finance Management Act and Treasury Regulations1st quarter 2019/20 Interim Financial Statement submitted to National Treasury by the end of July 2019AchievedThe 1st quarter 2019/20 Interim Financial Statement were submitted to National Treasury in June 2019According to the Interim Financial Statements, the Department spent R217 746 (21.73%) of its allocated budget of R1 002 143Not applicable1. Proper financial management in line with the Public Finance Management Act and Treasury Regulations1st compliance report on the BBBEE status submitted to the CFO by the end of September 2019AchievedThe 1st compliance report on the BBBEE status was submitted to the Chief Financial Officer in September 2019 44 orders amounting to R11 439 252 million which were procured using the 80/20 Preferential Point System. The 80/20 Preference Point System is applied for bids with a rand value of more than R30 000 but not exceeding R50 000Not applicable

130. Programme 1: Administration130Public Service and AdministrationIndicatorTarget Q2Output Q2Reason for Deviation Q2Number of quarterly performance information reports submitted by due dates to all internal and external control points1st quarter 2019/20 report on the implementation of the APP submitted to the Executive Authority, National Treasury and DPME by the end of July 2019The 1st quarter 2019/20 report on the implementation of the APP was submitted to the Executive Authority, National Treasury and DPME by the end of July 2019During the 1st quarter, the Department had 30 targets, of which 27 (89%) were achieved and (11%) were not achievedNot applicable

131. Programme 1: Administration131Public Service and AdministrationIndicatorTarget Q2Output Q2Reason for Deviation Q2Number of Internal Audit and Risk Management progress reports submitted to the Audit and Risk Committee1st quarter 2019/20 report on Internal Audit and Risk Management submitted to the Audit and Risk CommitteeAchievedThe 1st quarter 2019/20 report on Internal Audit and Risk Management was submitted to the Audit and Risk Committee in August 2019The following internal audits projects were conducted:• Review of the 2018/19 Annual Financial Statements• Review of the 2019/20 1st Quarter Interim Financial Statements• Review of the 2018/19 Annual Performance ReportNot applicableNumber of quarterly progress reports of the implementation of the DPSA’s Bi-lateral and Multi-lateral agreements1st quarter 2019/20 report on the implementation of the DPSA’s Bi-lateral and Multi-lateral programmes submitted to the Director-GeneralThe 1st quarter 2019/20 report on the implementation of the DPSA’s bi-lateral and multi-lateral programmes was not submitted to the Director-GeneralThe Director-General requested in July 2019 that a new reporting template be developed

132. Programme 2: Policy Development, Research and Analysis132Public Service and AdministrationIndicatorTarget Q2Output Q2Reason for Deviation Q2Incremental processes for the establishment of the Office of Standards institutionalised through the Strategic Framework for Norms and StandardsDraft regulations consulted with the Department of Cooperative Governance and Traditional AffairsThe draft regulations were consulted with COGTA in August 2019 as part of the broader consultation on the Public Administration and Management Act (PAMA)The consultations on the draft regulations are held to raise awareness on selected aspects on the draft regulations Office of Standards and ComplianceNot applicableIncremental processes for the establishment of the Office of Standards institutionalised through the Strategic Framework for Norms and Standards Structure, functions and governance arrangements for the Office of Standards designedThe structure, functions and governance arrangements for the Office of Standards was designed in July 2019 The structure, functions and governance arrangements for the Office of Standards are geared towards the establishment of frameworks and processes for the setting of norms and standardsNot applicable

133. Programme 2: Policy Development, Research and Analysis133Public Service and AdministrationIndicatorTarget Q2Output Q2Reason for Deviation Q2Level of compliance to legislative and regulatory requirements in relation to Public Service Norms and Standards monitoredWorkshop with selected departments to address areas of non-compliance and assess support required AchievedA workshop to address areas of non-compliance and assess support was conducted with the Eastern Cape Provincial Government in July 2019The workshops are held as part of the efforts to address the issue of non-compliance in the Public ServiceNot applicableMachinery of government reviewed in support of the implementation of PAMA, 2014Further support provided through engagements to The Presidency on machinery of government reconfiguration 2019AchievedFurther support was provided through engagements with the Presidency in July 2019The engagements focused on the Forum of South African Directors-General (FOSAD) members Mandate and Functions Analysis Report into South Africa’s Machinery of Government Project 2019 Not applicable

134. Programme 2: Policy Development, Research and Analysis134Public Service and AdministrationIndicatorTarget Q2Output Q2Reason for Deviation Q2Productivity Measurement Framework institutionalised as a measurement tool in the Office of StandardsNational workshop on linking organisational productivity assessment with the PMDS heldAchievedA national workshop on linking organisational productivity assessment with the PMDS was held in September 2019The purpose of the national workshop was to raise awareness on how organisational productivity assessments can be linked with the PMDSNot applicableProductivity Measurement Framework institutionalised as a measurement tool in the Office of StandardsNational workshop on linking organisational productivity assessment with the PMDS heldAchievedA national workshop on linking organisational productivity assessment with the PMDS was held in September 2019The purpose of the national workshop was to raise awareness on how organisational productivity assessments can be linked with the PMDSNot applicable

135. Programme 3: Public Service Employment and Condition of Service135Public Service and AdministrationIndicatorTarget Q2Output Q2Reason for Deviation Q2Quarterly reports on the average number of days taken to resolve disciplinary cases by all national and provincial departments1st quarter report for the 2019/20 financial year on the number of days taken to resolve disciplinary cases and precautionary suspension cases submitted to the Director-GeneralAchievedThe 1st quarter report for the 2019/20 financial year on the number of days taken to resolve disciplinary cases and precautionary suspension cases was submitted to the Director-General September 2019For the 1st quarter, the total number of misconduct cases in the Public Service was 749, of which 383 (51%) were finalised and 366 (49%) were pending. Out of the 383 cases finalised, 344 were finalised within 90 daysNot applicableReports on the implementation of the Government Employee Housing Scheme (GEHS)1st quarter 2019/20 report on the implementation of the GEHS submitted to the Director-General1st quarter 2019/20 report on the implementation of the GEHS was submitted to the Director-General in July 2019As of June 2019, 653 099 government officials eligible to receive government housing allowance were using their allowance on home ownership, while 289 088 were eligible to receive the government housing allowance receiving housing allowance were not owning homesNot applicable

136. Programme 3: Public Service Employment and Condition of Service136Public Service and AdministrationIndicatorTarget Q2Output Q2Reason for Deviation Q2Reports on the implementation of the Government Employee Housing Scheme (GEHS)1st quarter 2019/20 report on the implementation of the GEHS submitted to the Director-GeneralThe 1st quarter 2019/20 report on the implementation of the GEHS was submitted to the Director-General in July 2019As of June 2019, 653 099 government officials eligible to receive government housing allowance were using their allowance on home ownership, while 289 088 were eligible to receive the government housing allowance receiving housing allowance were not owning homesNot applicable

137. Programme 4: Government Chief Information Officer137Public Service and AdministrationIndicatorTarget Q2Output Q2Reason for Deviation Q2Public Service Digitalization Strategic FrameworkConsultations on the revised priority e-Government initiatives to support digital transformation for the public administration held with Department of Communications and Digital Technologies and Department of Home Affairs AchievedConsultations on the revised priority ICT initiatives to support digital transformation for the public administration were held with the Department of Communications and Digital Technologies (DCDT) in August 2019A consultation on the National Identity System (NIS) was held with the Department Home Affairs in September Not applicableReport on improvements made by all national and provincial departments in managing the cost related to IT procurement within the Public ServiceDraft report with preliminary findings compiledAchievedThe draft ICT expenditure report with preliminary findings was compiled in August 2019The ICT expenditure for the 2018/19 financial year was estimated at R38 millionNot applicablePublic Service Information Security StandardConsultation on the draft Public Service Information Security Standard held with ICT stakeholdersAchievedThe consultation on the draft Public Service Information Security Standard was held with ICT stakeholders in August 2019 The purpose of the Public Service Security Standard is to address persisting challenges regarding ICT security in government such as cyber-crime and threats to the country’s critical information infrastructureNot applicable

138. Programme 4: Government Chief Information Officer138Public Service and AdministrationIndicatorTarget Q2Output Q2Reason for Deviation Q2Revised Corporate Governance of ICT Assessment Standard2nd draft Corporate Governance of ICT Policy Framework developedAchieved The 2nd draft Corporate Governance of ICT Policy Framework developed in September 2019All departments are required to have a Corporate Governance of ICT which outlines the plans, strategies, architecture and operational procedures of all ICT related issues in a departmentNot applicable

139. Programme 5: Service Delivery Support139Public Service and AdministrationIndicatorTarget Q2Output Q2Reason for Deviation Q2Report on the implementation of the Operations Management Framework by the prioritised departmentsSupport provided through engagements to 3 departments for the implementation of the 3 building blocks of the Operations Management FrameworkAchievedSupport was provided through engagements on the implementation of the 3 building blocks of the Operations Management Framework was provided to selected national and provincial cluster departmentsNot applicableFramework for the establishment, promotion and maintenance of service centres developed2 workshops with national and provincial departments on the institutionalization of the Framework for the establishment, promotion and maintenance of service centres held Achieved:2 workshops were conducted with the following: • 8 Provinces • 10 national departments • Workshops were grouped in clusters for wider reach and efficient utilisation of limited resources.The purpose of the workshops was to support departments in institutionalising the Framework for the establishment, promotion and maintenance of service centresNot applicable

140. Programme 5: Service Delivery Support140Public Service and AdministrationIndicatorTarget Q2Output Q2Reason for Deviation Q2Framework for the establishment, promotion and maintenance of service centres developedDraft service delivery model for the public service developedAchievedThe draft Service Delivery Model for the Public Service was developed in July 2019The model aims to guide national and provincial departments in conducting their own service delivery modelsNot applicableReport on the quality and progress with the implementation of the SDIPsSupport provided through engagements to sector departments AchievedThe support was provided through engagements to all sector departments in July 2019The purpose of the workshop was to assist departments in improving the quality of their SDIPNot applicable

141. Programme 5: Service Delivery Support141Public Service and AdministrationIndicatorTarget Q2Output Q2Reason for Deviation Q2Report on the number of national and provincial departments implementing the Batho Pele principles and standards2 provincial and 4 national departments supported through engagements on the implementation of the Batho Pele programmesAchievedSupport was provided to the Department of Health, Department of Environment, Health and Sanitation, Department of Home Affairs and Department of Public Works in July 2019Support was also provided to Mpumalanga, Gauteng and KwaZulu-Natal in July 2019Due to the demand by departments, additional support was provided than plannedNot applicableReport on the number of national and provincial departments implementing the Batho Pele principles and standardsVisits to social sector departments conductedAchieved Visits to assess the implementation of Batho Pele principles and standards were conducted with the social and health sectors in Mpumalanga and KwaZulu-Natal in July 2019The health sector was included in the assessment in order to gather more dataNot applicable

142. Programme 6: Governance of Public Administration142 Public Service and AdministrationIndicatorTarget Q2Output Q2Reason for Deviation Q2Improved adherence by Public Service employees in national and provincial departments to the Directive on the performance of other remunerative work Workshop with selected national and provincial departments to consult on the proposed guidelines heldNo work was undertaken during the 2nd quarterThe establishment of Public Administration, Ethics, Integrity and Disciplinary Technical Assistance Unit (PAEIDTAU) has taken precedence over other work

143. DTI Programme 1: Administration143IndicatorTarget Q2Output Q2Reason for Deviation Q23.1 Percentage (%) of staff turnover (unexpected)1.7%(3.4% year to date)0.4Actual turnover was less than the target3.2. Percentage (%) of people with disability employed3.60 %4.0 %Two additional employees disclosed their disability during Q23.3 Percentage (%) of Women employed in senior management positions50 %54 %% of women in SMS exceeded due to 1 male SMS members terminated services during Q2. 3 male and 3 female SMS appointments were made in the period, therefore resulting in no change from Q1. 3.4 Percentage (%) of eligible creditors payments processed within legal time-frames100% eligible creditors’ payments made within 30 days100% of 6 634 eligible creditors’ payments were made within 30 days. (65% of 6 634 payments were made within 15 days and remainder was processed within 30 days) Target exceeded due to more stringent reviews on the turnaround times through daily statistics

144. DTI Programme 2 Public Sector Organisational and Staff Development144IndicatorTarget Q2Output Q2Reason for Deviation Q2Professionalised training facilitator recruited as part as part of Rutanang Ma Afrika initiatives (including Independent Individual Contractors as well as serving and retired 1 Training of Trainers(TOTs) or TrainerLearners Networks(TLNs) held by theend of the quarter6 Training of Trainers (TOTs) Trainers Learning Networks (TLNs) held by the end of the quarter.Each training stream hosted their ToTs due to the increasing need to have trainer’s quality improved for better service provision. Number of memorandum of agreement (MOAs) signed with the public sector departments and other organs of the state Sign 5 MOAs with the public sector departments and other organs of the state(cumulative)Cumulative 4 MOAs with the public sector departments and other organs of the state signed.Administrative delays led to deferral in the signing of pending MOAs. 1.1 Number of status reports on regional economic integration1 status report produced on progress of TFTA negotiationsStatus report on progress on TFTA negotiations Status report on progress on TFTA negotiations1.1 Number of status reports on regional economic integration+F9:J91.2 Number of reports on Implementation of SADC-EU Economic Partnership Agreement (EPA)Status report on the implementation of the EPAStatus report on implementation of the SADC-EU EPAStatus report provided

145. DTI Programme 2 Public Sector Organisational and Staff Development145IndicatorTarget Q2Output Q2Reason for Deviation Q2Number of status reports on engagements in Global fora (BRICS,G20,AGOA,Uk Brexit)4 status report produced on engagements in each Global Fora 4 status reports produced on engagements in Global Fora N/ANumber of status reports on regional economic integration1 status report on progress of CFTA negotiationsstatus report produced on progress on AfCFTA negotiationsStatus report producedIndicatorTarget Q2Output Q2Reason for Deviation Q2 1.7 Number of interventions to support BIs in the IPAP Sectors (non-financial)20 interventions to support BIs in the IPAP sectors (non-financial)21Due to strategic partnerships with key stakeholders the BI Unit managed to exceed the targetProgramme 3: Special Economic Zones and Economic Transformation

146. DTI Programme 4: Industrial Development 146IndicatorTarget Q2Output Q2Reason for Deviation Q21.8 New iteration of IPAP submitted to Minister for tabling in Cabinet annuallyNilN/AN/a1.9 Number of implementation reports on IPAP prepared for the Minister’s Review Meetings per year1 Implementation report on IPAP prepared for the Minister’s Review Meetings per quarterNo Implementation report on IPAP was prepared The new Re-imagining strategy was approved in the Previous Quarter by Cabinet.

147. DTI Programme 5: Consumer and Corporate Regulation147IndicatorTarget Q2Output Q2Reason for Deviation Q22.1 Number of Socio-Economic Impact Assessment System (SEIAS) reports (previously RIA reports) developed for Minister’s approvalFirst Draft SEIAS report on the Companies Amendment Bill developed for Minister’s approvalFirst Draft SEIAS report on the Companies Amendment Bill not developed for Minister’s approvalSEIAS report concluded in quarter 12.2 Number of progress reports developed for Minister's approval1 progress report on the development of the Companies Amendment Bill developed for Minister’s approval1 progress report on the development of Gambling, Liquor, Credit, Performers Protection, Companies and Copyright Amendment Bill developed for Minister’s approvalThe Credit Amendment Bill had been signed into Law by the President. The Copyright and Performers Protection Amendment Bill are awaiting the President's signature

148. DTI Programme 6: Incentive Development and Administration 148IndicatorTarget Q2Output Q2Reason for Deviation Q21.11 Value (Rand) of projected investments to be leveraged from projects/enterprises approvedR4.5bnR10.5 bnApproved AIS , CIP and BPS/GBS projects resulted in high value of projected investments 1.12 Projected number of new jobs supported from enterprises approved150012704Approved BPS/ GBS projects contributed to 84% of new jobs supportedProjected number of jobs retained from approved enterprises and projects20005287Approved AIS projects are sustaining high number of jobsNumber of enterprises/projects approved for financial support across all incentives250163Approved AIS projects are sustaining high number of jobs

149. DTI Programme 7: Trade Investment South Africa149IndicatorTarget Q2Output Q2Reason for Deviation Q21.15 Value of export sales generated R2.1bnR1,014bnOur traditional events with high Roll recorded a relatively low export sales this year. furthermore o sales recorded for midest due to subcontracting nature of the business 1.16 Number of companies assisted under EMIA in supporting value added exports216279FACIM National PavilIon in Mozambique was added to the NP list which led to increase in the number of companies assistedIndicatorTarget Q2Output Q2Reason for Deviation Q21.17 Value (Rand) of investment projects facilitated in pipeline R10bnR7. 782 bnInvestment amounts for projects on register not all confirmed.Programme 8: Investment South Africa

150. DTPS Programme 1: Administration150IndicatorTarget Q2Output Q2Reason for Deviation Q24.2.1 Financial management in line with the Public Finance Management Act and Treasury RegulationsImplementationof the approved2019/20DepartmentalBudget monitoredThe implementation of the approved 2019/20 Departmental Budget monitored. 4.2.1 Financial management in line with the Public Finance Management Act and Treasury RegulationsImplementationof the approved2019/20Procurement PlanmonitoredQuarterly monitoring report on the implementation of the approved 2019/20 Procurement Plan was developed. 4.2.2 Approved Strategic Risk Assessment Reports and Risk RegisterQuarterlyprogress reporton risk mitigationdevelopedQuarterly progress report on risk mitigation has been developed, presented to relevant Governance Structures (REC & AC) for consideration, inputs and comments. 

151. DTPS Programme 2: International Affairs and Trade151IndicatorTarget Q2Output Q2Reason for Deviation Q22.3.1 Number of RSA Positions developed4th ATU WRC19 Preparatorymeeting hosted4th ATU APM for WRC was hosted by South Africa in East London. The official report of the African Telecommunication Union is attached. 2.3.1 Number of RSA Positions developedRSA Position Paperapproved foradvancementat the BRICS ICTMinisterial 2019meetingPosition Paper signed and position advanced in 5th BRICS Ministers of Communications Meetings on 12 -14 August 2019 in Brazil. 

152. DTPS Programme 3: ICT Policy, Research and Capacity Development 152IndicatorTarget Q2Output Q2Reason for Deviation Q22.1.1 ICT Legislation in line with the National Integrated ICT Policy White PaperFacilitation of theimplementationof the Programmeto support,sustain and growexisting ICT SMMEbeneficiariescommenced andprogress reportdevelopedReports on the implementation of the programme to support, sustain and grow existing ICT SMME beneficiaries have been developed. The reports covers the following interventions: Cell phone Repair project, fibre and Wi-Fi training project, tech for safety summit and hackathon, Masterclass/Women in ICT project and the SMME International Competitiveness programme aligned to ITU. 3.1.1 Implemented National e-StrategyDigitaltransformationconference forlocal governmenthostedConference will be held in December 2019Minister has many other engagements in October & November (GovTech, AfricaCom etc). Also SALGA has their yearly conference in mid-November.

153. DTPS Programme 4: ICT Enterprise Development and Public Entities Oversight 153IndicatorTarget Q2Output Q2Reason for Deviation Q22.1.1 Implemented State ICT Infrastructure Company ActState ICTInfrastructureCompany Billsubmitted toCabinet for publicconsultationapprovalTarget not achieved, the Bill not yet submitted to Cabinet for public consultationFinalisation of the business case and delays in receiving the accompanying certificates from the State Law Advisor and DPME.2.1.2 Implemented State IT Company ActState IT CompanyBill submitted toCabinet for publicconsultationapprovalTarget not achieved, Bill not yet submitted to Cabinet for public consultationFinalisation of the business case and delays in receiving the accompanying certificates from the State Law Advisor and DPME.4.1.1 Number of Quarterly SOE Performance Report7 Quarterly SOEPerformanceReports developedand submitted (Q1of 2019/20)NEMISA, USAASA, Sentech, SAPO, BBI, SITA and ZADNA Q1 performance reports and financials analysed and recommendations made to the Minister.7 Quarterly SOEPerformanceReports developedand submitted (Q4of 2018/19)4.1.2 Corporatised PostbankDraft PostbankAmendment BilldevelopedDraft Postbank Amendment Bill was developed. 

154. DTPS Programme 5: ICT Infrastructure Support Oversight 154IndicatorTarget Q2Output Q2Reason for Deviation Q21.1.1 Availability of Broadband Services on connected sitesQ1 (2019/20)monitoring reportdeveloped onthe provision ofbroadband services to570 connected sites194 of 413 facilities connected by Q1 were monitored during Q1. At the end of Q2 561 facilities were connected.The delay in SITA's internal process transfer the details of the connected facilities onto its service monitoring platform.1.1.1 Availability of Broadband Services on connected sitesResolution of issuesreferred to the RDCCfacilitated and quarter2 progress reportdevelopedStakeholders were adequately engaged and consulted 

155. Department of Water and Sanitation Programme 1: Administration 155IndicatorTarget Q2Output Q2Reason for Deviation Q23.3.1.2 Percentage of targeted procurement budget spent on qualifying small enterprises (QSE)15 %15 %n/a3.3.2.2 Percentage of targeted procurement budget spent on exempted micro enterprises (EME)15 %40 %The implementation of the PPR2017 has assited in achieving the target.Target was overachieved due to procurement which was done through the price quotations of which the commodities could be supplied by the EME Companies and the existing contracts.4.3.3 Number of debtor days150178 daysTarget was not achieved mainly due to the persistent problem of Municipalities and Water Boards not settling their debts, This is despite the interventions by the etablished Inter-ministerial committee and the legal services4.3.4 Percentage vacancy rate for engineers and scientists=10%115% filled. 737 posts filled out of 640 permanent posts). Formula: 737/640*100=115%The Department has a total establishment of 640 permanent posts on Persal. The Department has filled a total of 737 posts, 1ith 198 being additional to the establishment.

156. Department of Water and Sanitation Oversight Programme 1: Administration 156IndicatorTarget Q2Output Q2Reason for Deviation Q25.2.1 Percentage implementation of the 2019/20 Annual Communications Programmei48 %85 %Reframing the media agenda on Water and Sanitation matters.Re framing the media agenda on Water and Sanitation matters3.3.1.1 Percentage of targeted procurement budget spent on qualifying small enterprises (QSE)15 %43 %Off the total procurement for quarter 2 43% of the contracts were awarded to QSEs3.3.2.1 Percentage of targeted procurement budget spent on exempted micro enterprises (EME)15 %39 %Off the total procurement for quarter 2 39% of the contracts were awarded to EMEs4.3.2 Percentage expenditure on annual budget40 %37 %The overall expenditure of the department has improved however , due to vacant posts across all programmes which have a cummulative effect on the coming months-the department is underspending by 3% which is largely due to compensation of employees.5.1.1 Analyses on progress against the approved annual International Relations Implementation PlanQuarterly analysis on the implementationof the approvedinternational relationsprogrammeQuarterly analysis compiledn/a

157. Department of Water and Sanitation Programme 2: Water Planning and Information Management157IndicatorTarget Q2Output Q2Reason for Deviation Q2Programme 2: Water Planning and Information ManagementQuarterly analysis onthe implementationof the approvedinternational relationsprogrammeQuarterly analysis compiledn/a2.1.1 National Water and Sanitation master plan (NWSMP) adoptedNational Water andSanitation MasterPlan OperationPhakisa LabPreparationOperation Phakisa Lab preparationn/a2.2.4 Number of reconciliation strategies completed for various systems (WSS)11n/a2.2.5 Number of operating rules and specialist strategy studies completed annually for various water supply systems4312.2.6 Number of updates climate change for Risk and Vulnerability Assessments completed annually for various water supply systemsFish Tsitsikama: catchmentDeveloped adaption options as appropriate for the Fish-TsitsikamacatchmentMiddle Vaal -Updated the climate change Risk and VulnerabilityAssessment and develop adaptionoptionsAchievedDeveloped adaption options as appropriate for the Fish-Tsitsikama catchmentAchievedUpdated the climate change Risk and VulnerabilityAssessment and develop adaption options as appropriate for the Middle Vaaln/a

158. Department of Water and Sanitation Programme 2: Water Planning and Information Management158IndicatorTarget Q2Output Q2Reason for Deviation Q21.3.1 Number of river systems with water resources classes and determined resource quality objectives(1)Submit draft legalnotice to legal servicefor final vettingThe final legal notice was submitted to legal services for final vetting in September 2019Submit final legalnotice for translation1.3.1 Number of river systems with water resources classes and determined resource quality objectives(3)Update final legalnoticeThe legal Notice was updated. The submission to Minister for approval to gazette final notice is on routeSubmit final legalnotice to legal servicesfor final vetting1.3.1 Number of river systems with water resources classes and determined resource quality objectives(2)Update final legalnoticeThe legal Notice was updated. The submission to Minister for approval to gazette final notice has been drafted and recommended by the Deputy MinisterSubmit final legalnotice to legalservices for finalvetting1.2,1 Number of water resources monitoring programs reviewed and maintained3301.2.2 Number of water and sanitation information systems maintained6511.3.2 Number of rivers in which the River Ecostatus Monitoring Programme is implemented537550

159. Department of Water and Sanitation Programme 2: Water Planning and Information Management159IndicatorTarget Q2Output Q2Reason for Deviation Q21.4.1 Number of large water supply systems assessed for water lossesCollection of waterbalance data andInformation frommunicipalities withinthe 4 large watersupply systems• Vaal River• Umngeni River• Crocodile WestRiver• Western CapeWater SupplySystemCollected IWA water balances from municipalities within the 4 large water supply systems 1. Intergrated Vaal River System2. Umgeni River WSS3. Western Cape WSS and4. Crocodile West River WSSStakeholderconsultations on IWAwater balance dataand information2.1.2 Number of district municipalities (DMs) with completed 5 year water and sanitation services master plansDraft populatedstructure documentsfor Governance andFunctionality workstreams for 17 DMsNot Achieved.Developmentof structuredocumentation2.1.4 Number of Municipal Strategic Self- Assessments (MuSSA) completed within the WSAs, metros and secondary cities18170

160. Department of Water and Sanitation Programme 2: Water Planning and Information Management160IndicatorTarget Q2Output Q2Reason for Deviation Q22.2.2 Number of feasibility studies for water and wastewater services projects (RBIG) completedCo-ordinate andupdate progress of 5feasibility studiesProgress report on 5 feasibility studiesVerification andprioritizationprogramme withregional offices andfinalisation of projectlist2.2.3 Number of implementation readiness studies for water and wastewater services projects (RBIG) completedCo-ordinate andupdate progress of5 implementationreadiness studies.Progress report on 5 implementation readiness studies. Verification andprioritizationprogramme withregional offices andfinalisation of projectlist2..1.5 National Sanitation Integrated PlanConcept PaperdevelopedPartially Achieved: Preliminary Socio Economic Impact Assessment Report doneDesktop analysis andliterature review4.1.1 Approved National Water Resources Strategy Edition 3 (NWRS3) implementation planInternal consultationon the Draft NWRS3Internal consultation was held on the 26 August 2019 with appointed NWRS3 Project Steering Committee (PSC) members to oversee and ensorse the project. Another internal consultation was held on the 4 September 2019 with NWRS-3 Task Team. Conversion of theNWSRSS to NWRS3

161. DWS Programme 3: Water Infrastructure Development161IndicatorTarget Q2Output Q2Reason for Deviation Q22.3.1 Number of bulk raw water projects ready for implementation (1)Land Acqusiotion andresettlement The tender documents were completed (per Q1 milestone).• Engagements were held with Sekhukhune District Municipality, Kgosi Maroga & Fetakgomo Tubatse Local Municipality to finalise the Memorandum of Understanding (MOU) for access to communal land for the pipeline servitude.• The Terms of Reference for the establishment of a Project Management Office (PMO) that will facilitate community consultations during the land acquisition and resettlement process were approved.Tender documentcompleted2.3.1 Number of bulk raw water projects ready for implementation (2)Tender design• The PSP performance issues were addressed through proposed replacements of key project team members.• The final baseline Program and the Inception Report were submitted.• TOR for additional studies were approved and procurement of subcontractor commenced.Tender design

162. Programme 1: Administration162Social DevelopmentIndicatorTarget Q2Output Q2Reason for Deviation Q2Entity governance and oversight framework implementedQuarterly report produced on compliance to governance and oversight frameworkQuarter 1 SASSA report distributed for analysis and inputs to other business units that have an interest on the reporting of SASSA. An analysis on Q1 report for 2019 analysed and feedback to be finalized when inputs from the business units are provided The deviation is that this is not in line with approved oversight FrameworkAudit report on Annual Financial Statements (AFS) 1st Quarter Interim Financial Statements for the 2019/20 financial year submitted for audit The 1st Quarter Interim Financial Statements for the 2019/20 financial year was submitted to NT on 31 July 2019. No deviation

163. Programme 2: Social Assistance and Programme 3: Social Security Policy and Administration163Social DevelopmentIndicatorTarget Q2Output Q2Reason for Deviation Q2Monthly transfer of funds (R'000) to SASSA100%(R14 596 299) transferred to SASSA monthlyA total of R43,495 billion was transferred to SASSA during the second quarter. The monthly breakdown was as follows: July R14,454 billion, August R 14,489 billion and September R14,550 billionNo deviationPolicy on mandatory cover for retirement, disability and survivor benefits Update the draft policy paper with inputs from NEDLAC social partners. Draft policy paper updatedNo deviation Policy on voluntary inclusion of informal sector workers in social security Update draft paper with inputs from the technical report.Draft policy paper updated No deviation Policy on linking child support grants beneficiaries to government services Draft costing on possible options Preliminary draft costing compiled No deviation Draft regulations to support the implementation of the Social Assistance legislationDraft regulations to support the implementation of the Social Assistance legislationRegulations were drafted on CSG top-up and appealsNo deviation

164. Programme 4: Welfare Services Policy Development & Implementation Support164 Social DevelopmentIndicatorTarget Q2Output Q2Reason for Deviation Q2White Paper on Social WelfareSubmit the White Paper for Social Welfare for consideration by Cabinet The White Paper could not be presented to CabinetThe White Paper for Social Development could not be presented to Cabinet as it was not yet finalizedSocial Development Bill developedConsultation on the Draft Framework on Social Development in 5 provincesThe draft framework on Social Development Bill was consulted in 5 provincesNo deviationNumber of provincial inter-sectoral capacity building workshops on the National Plan of Action for Children (NPAC) 3 Provinces capacitated on the NPAC Three capacity development sessions were conducted in three Provinces, i.e. Gauteng, Eastern Cape and Western CapeNo deviationChildren’s Amendment Bill developedParticipate in the Parliamentary process to approve the Children's Amendment Bill Parliamentary process to approve the Children'sAmendment Bill have not commencedDelays in Parliamentary processes

165. Programme 4: Welfare Services Policy Development & Implementation Support165Social DevelopmentIndicatorTarget Q2Output Q2Reason for Deviation Q2Guidelines on Community-Based Prevention and Early Intervention Services to vulnerable children implemented Seek approval on the Guidelines for Community based Prevention and Early Intervention services to vulnerable children from the relevant structuresThe Guidelines for Community based Prevention and Early Intervention services to vulnerable children approvedNo deviationInter-sectoral Protocol on the Management and Prevention of Violence against Children, Child Abuse, Neglect and Exploitation Present to Heads of Social Development Presentation to HSDS was not conductedHSDS meeting postponedECD service delivery model developed Conduct desktop analysis on South African current delivery models Desktop analysis on South African current delivery models conductedNo deviationPolicy Framework on Accreditation of Diversion Services Monitor the implementation of the Policy Framework on Accreditation of Diversion Services in 2 provinces Monitoring of the implementation of the Policy Framework did not take place as planned for the 18 and 25 September 2019 in both Western Cape and North West provincesThe two provinces shifted the dates of the 18 and 25 September to the third quarterCapacity building on the DSD Anti-Gangsterism Strategy Training on the Department of Social Development (DSD) Anti- Gangsterism Strategy in two province Training conducted in KwaZulu-Natal on the 27-28 August 2019No deviation

166. Programme 4: Welfare Services Policy Development & Implementation Support166Social DevelopmentIndicatorTarget Q2Output Q2Reason for Deviation Q2National Drug Master Plan (NDMP) implementedSubmit Draft NDMP for approvalDraft National Drug Master Plan submitted to Minister, office seek approval in cabinetNo deviationCapacity building on Universal treatment curriculum conductedCapacitate 2 provinces on Universal treatment curriculumCapacitated Eastern Cape, Free State and Gauteng Provinces on Universal Treatment CurriculumNo deviationInter-sectoral policy on sheltering services developedAppointment of the service providerService provider for technical support was not appointedAppointment process in progress. Evaluation of service provider proposal was done and submission for the approve to appoint the provider was approvedPolicy on provision of counsellingAppointment of the service providerService provider for technical support was not appointedAppointment process is in progress. Two proposals were sourced. Submission is on route to appoint committee member to evaluate the proposalsA revised White Paper on Families.Appointment of the service provider.The terms of reference were developed, approved, and sent to Supply Chain for the appointment of the service provider.Due to delays on internal procurement processesIntegrated Action Plan to respond to the social and structural drivers of HIV, tuberculosis (TB) and sexually transmitted infections (STIs)Consultative session with National Departments on the draft Integrated Action Plan Consultativesession with National Departments not held A need to first strengthen internal DSD Contributions was identified before engaging external stakeholders.

167. Programme 4: Welfare Services Policy Development & Implementation Support167Social DevelopmentIndicatorTarget Q2Output Q2Reason for Deviation Q2Number of Psychological Support Services (PSS) capacity building workshops conducted in nine provinces. 33No deviationPolicy instruments (tools, guidelines, policy briefs, discussion papers and research reports) developed to support domestication of international treaties and implementation of WPRPDNational Frameworks on Disability Rights Awareness and Self-Representation validated by National Disability Rights MachineryDraft Frameworks on Universal Access Design, Reasonable Accommodation, Disability rights Awareness and Self-Representation Support are currently being aligned with the national macro-organisation of governmentNational Macro-Organisation of government process has resulted in a realignment of functions and in instances, departments. National Disability Rights Machinery strengthenedGuidelines for Disability Inclusion in Strategic Plans, Annual Performance Plans and IDPs for 2020-2025 finalisedDisability Inclusion submission developed for Medium Term Strategic Framework in consultation with the National Disability Rights Machinery (NDRM) plenary as well as Inter-Provincial ForumNo diviationPerformance reports on implementation of WPRPD developedImplementation plan for automated reporting developedNegotiations have taken place with UN Office of the High Commission on Human Rights, DIRCO, DoJ&CD, NYDA, DSD and the SAHRC on the feasibility of integrating an automated reporting system for the country by adopting the UN tracking system.The Inter-Departmental Committee on International Treaty Body Reporting has not yet been approved by Cabinet.

168. Programme 4: Welfare Services Policy Development & Implementation Support168Social DevelopmentIndicatorTarget Q2Output Q2Reason for Deviation Q2Policy and legal instruments that support services to persons with disabilities and their families developed -Applicable in the third quarter Community-Based Disability Inclusive Development Programme pilotedGood practice models on CBID developed in four provincesDeveloped CBID programme in Limpopo, Eastern Cape, Kwa Zulu Natal and Free State No deviation

169. Programme 5: Social Policy and Integrated Service Delivery169Social DevelopmentIndicatorTarget Q2Output Q2Reason for Deviation Q2Coordinate implementation of the EPWP Social Sector Phase 4 PlanProvincial Business Plans developed 4 Provincial Business Plans developed, the four provinces are WC, NW, EC and FS The other 5 provinces are still in the process of finalizingNumber of progress reports on the implementation of the White Paper on Population Policy and the ICPD PoA This indicator is applicable for reporting in the third quarter Number of progress reports on the implementation of the White Paper on Population Policy and the ICPD PoAICPD +25 synthesis report stakeholder consultations ICPD +25 synthesis report stakeholder consultations done and a draft report producedNo deviation NPO registration applications processed within two months of receiptAll received NPO applications processed within 2 months Received 8 715 applications and processed 8 621 and 8 599 (98.7%) of received applications were processes within two monthsNo deviation NPO reports processed within two months of receiptAll submitted reports of registered NPOs are processed within 2 monthsReceived 13 849 reports and processed 4 177 and 2 908 (21%) of received reports were processes within two monthsThe deviation is due to huge responses from the NPOs that submitted reports. Too many reports were sent which is too much for the current staff that the NPO has at the present moment. The Directorate has embarked on the Know Your NPO Status Campaign since September of 2018.which encourages non compliant NPOs to submit their reports. During the quarter officials were involved in a ”one week in one week out of the office" Compliance Drive in order to provide out- reach service in support of NPOs when submitting reports.

170. Programme 5: Social Policy and Integrated Service Delivery170Social DevelopmentIndicatorTarget Q2Output Q2Reason for Deviation Q2NPO Act amendedPresent the NPO Bill to Social Cluster The Bill was sent to finance for costing before we could send to the Cluster for processing. The costing of the bill could not be finalized before this quarter.The delay in costing of the bill within the department was the main cause of the delay this quarterDSD Sector Funding Policy Conduct diagnostic evaluation in two province to assess readiness towards implementation of the Policy Diagnostic evaluation was done in two provinces where the unit engaged with provincial Coordinators on 12 & 13 August 2019 to assess readiness for implementation of the NPO Policy and to share the future Project Plan. approved by the HSDS Forum on 15 August 2019. No deviation DSD-NPO Partnership Model Engage relevant stakeholders on the revised partnership tools Relevant stakeholders were engaged on the new and revised Partnership model Terms of reference for the establishment of the DSD-NPO Forum were developed and shared with the task team for input.No deviation Community Development Practice Policy implemented Capacity Building of three (3) Provincial Community Development Practice Forum Conducted Capacity Building of three (3) Provincial Community Development Practice forums on the practice policyNo deviation

171. Programme 5: Social Policy and Integrated Service Delivery171Social DevelopmentIndicatorTarget Q2Output Q2Reason for Deviation Q2Social Development Youth Strategy Provincial workshops on the implementation of Youth StrategyConducted Five (5) Provincial workshops to facilitate the implementation of the youth strategy No deviationCommunity Mobilisation and Empowerment Framework developedWorkshop CDPs in 3 provinces on the Community Mobilisation and Empowerment Framework Conducted Workshops of CDPs in four (4) Provinces on the Community Mobilisation and Empowerment FrameworkNo deviationFramework on Asset Based Community Development Approach implementedConduct capacity building on Asset Based Community Development Approach in 5 provinces Capacity Building on Asset Based Community Development Approach conducted in five (5) provinces: GP, KZN, NC, FS, MPNo deviationFramework on the Developmental model for Community Nutrition and Development Centres (CNDCs).Conduct capacity building on the developmental model for CNDCs in 3 provincesCapacity Building on the Developmental Model for CNDCs conducted in five ( 5) provinces: GP, KZN, NC, FS, and MP.No deviation Framework on Women Empowerment developedConduct capacity building on Women Empowerment Framework to three provinces Capacity Building on Women Empowerment conducted in five (5) provinces: GP, KZN, NC, FS, and MPNo deviation

172. Programme 5: Social Policy and Integrated Service Delivery172Social DevelopmentIndicatorTarget Q2Output Q2Reason for Deviation Q2National food and nutrition security plan implemented.Establish Provincial technical working group on Food and Nutrition security three provincesTechnical working group on Food and Nutrition security established in Three Provinces (3) NW, FS & Mp provincesParticipated in the national multi-stakeholder food and nutrition security feedback session.No deviation Number of vulnerable individuals accessing food.103 750 vulnerable individuals accessing food103 000 No deviationNumber of vulnerable individuals accessing food.Development of the transition and hand over plan Transition and hand over the plan developed & shared with provinces, CFOs & DSD forums.Task team meet bi-monthly to monitor progressNo deviation

173. Programme 1 :Administration173Science and TechnologyIndicatorTarget Q2Output Q2Reason for Deviation Q2DST public entities’ strategic and annual performance plans approved by the Minister and shareholder compacts signed by the Minister and chairpersons of the boardsFirst draft APPs forDST public entitiessubmitted to NTand the DPME by31 August 2019,Annual reportsof public entitiestabled in Parliamentby 30 September20190No preliminary report received from the Programme Number of media articles written to raise the DST's public profile8 media articleswritten to raise theDST’s public profile0No preliminary report received from the Programme Number of public participation programmes held2 publicparticipationprogrammes held0No preliminary report received from the Programme

174. Programme 2 :Technology Innovation174Science and TechnologyIndicatorTarget Q2Output Q2Reason for Deviation Q2Number of instruments funded in support of knowledge utilisation8 instrumentsfunded in supportof knowledgeutilisationNo targetNo preliminary report received from the ProgrammeNumber of new disclosures reported by publicly funded institutionsNo target No targetNo preliminary report received from the ProgrammePercentage of regulatory recommendations made to the GMO Executive Council through DAFF to support decisionmaking100% of regulatoryrecommendationsmade fromapplicationsreceived to supportdecision making0No preliminary report received from the ProgrammeNumber of trainees attending training initiatives in designated areasNo targetNo targetNo preliminary report received from the Programme

175. Programme 3 :International Cooperation and Resources175Science and TechnologyIndicatorTarget Q2Output Q2Reason for Deviation Q2Number of international partner organisations (i.e. legal entities) collaborating with South African partners within the formalized framework of collaborative research, innovation or STI HCD projects accounted as part of cooperation initiatives facilitate50 international partnerorganisations (i.e. legal entities) collaborating with South African partners within the formalized framework of collaborative research, innovation or STI HCD projects part of cooperation initiatives facilitated by the DST0No preliminary report received from the ProgrammeNumber of dedicated international technical exchanges such as workshops, seminars or training programmes to reinforce South Africa’s capacities in key STI domains specifically referenced in the DST Strategic Plan, undertaken with the support of internatio5 dedicated international technicalexchanges to build or reinforce South Africa’s capacities in key STI domains specificallyreferenced in the DST Strategic Plan, undertaken with the support of internationalpartners and facilitated by the DST0No preliminary report received from the Programme

176. Programme 3 :International Cooperation and Resources176Science and TechnologyIndicatorTarget Q2Output Q2Reason for Deviation Q2Number of formally recorded decisions made in intergovernmental STI forums, such as multilateral organisations, with a direct bearing on resource allocation to support priorities of government’s Programme of Action following specific DST intervention2 formally recorded decisions made inintergovernmental STI forums, such as multilateral organisations, with a direct bearing on resource allocationto support priorities of government’sProgramme of Action followingspecific DST intervention0No preliminary report received from the ProgrammeNumber of leadership positions occupied by South Africa in international STI governance structures relevant to influencing resource allocation to support priorities of government’s Programme of Action following specific DST intervention2 leadership positions occupied by South Africa in international STI governance structures relevant to influencing resource allocation to support priorities of government’s Programme of Action following specific DST intervention0No preliminary report received from the Programme

177. Programme 4:Research Development and Support177Science and TechnologyIndicatorTarget Q2Output Q2Reason for Deviation Q2Number of research infrastructure grants awarded as per award letters annuallyCall for proposals on awardingof research infrastructuregrants issued by 30 September 2019Call for proposals on awarding of research infrastructure grants issued by 30 September 2019 -Number of science mode receivers installed on MeerKATSKA SA Project approved progress report on installation of LSP science modes on MeerKAT correlator provided by30 September 2019Approved SKA SA project report on installation of LSP science modes on MeerKAT correlator was provided by 30 September 2019.  -Total number of PhD students awarded bursaries annually as reflected in the reports from the NRF and relevant entitiesNot less than 2 300 PhD students awarded an annualbursary as reflected in the reports from NRF and relevantentities 2721 PhD students awarded bursaries as reflected in the NRF and relevant entities by 30 June 2019. -Total number of pipeline postgraduate students awarded bursaries annually as reflected in the reports from the NRF and relevant entitiesNot less than 8 100 pipelinepostgraduate students (Btech and honours, andmaster’s students) awarded an annual bursary7710 pipeline (BTech and honours, and master’s students) awarded bursaries as reflected in the NRF and relevant entities by 30 June 2019 -

178. Programme 4:Research Development and Support178Science and TechnologyIndicatorTarget Q2Output Q2Reason for Deviation Q2Total number of graduates and students placed in DST-funded work preparation programmes in SETI institutions550 graduates andstudents placedin DST-fundedwork preparationprogrammes inSETIInstitutions672 graduates and students placed in DST-funded work preparation programmes in SETI Institutions -Total available broadband capacity provided by SANReN per annumNew links andupgrade planfinalised by30 September 2019A plan and links were finalised and being followed to achieve the financial year target. Total number of researchers awarded research grants through NRF-managed programmes as reflected in the NRF project reportsNot less than3 500 researchersawarded researchgrants throughNRF-managedprogrammes2 557 researchers awarded research grants through NRF-managed programmes as reflected in the NRF project reports.Number of participants in science awareness and engagement programmes annually as reflected in project reports of the NRF and other service providers.National ScienceWeek held by 30September 2019Performance information report not yet received from the entity.

179. Programme 5: Socio-Economic Innovation Partnerships179Science and TechnologyIndicatorTarget Q2Output Q2Reason for Deviation Q2Number of honours, master’s and doctoral students fully funded or co-funded in designated niche areasNo targetNo target Number of knowledge products on innovation for inclusive development published2 knowledgeproducts oninnovationfor inclusivedevelopmentpublished between1 April 2019 and30 September 20192 knowledge products on innovation for inclusive development published between 1 April 2019 and 30 September 2019 Number of decision-support interventions introduced and maintainedAnnual work planapproved for atleast 8 decisionsupportsystemsbetween 1 April2019 and 30September 2019Annual work plan approved for at least 7 decisionssupport systems between 1 April 2019 and 30 September 2019 

180. Programme 5: Socio-Economic Innovation Partnerships180Science and TechnologyIndicatorTarget Q2Output Q2Reason for Deviation Q2Number of learning interventions (seminars, briefs, policy papers) generatedAt least 2 learning interventions (seminars) between 1 April and 30 September 2019At least 2 learning interventions (seminars) between 1 April and 30 September 2019 Number of knowledge and innovation products (for example, patents, prototypes, technology demonstrators, methodologies, and technology transfer packages) added to the sustainable development IP portfolioAt least 1 knowledge or innovation products added to the industrial development IP portfolio between 1 April 2019 and 30 September 2019At least 9 knowledge or innovation products added to the industrial development IP portfolio between 1 April 2019 and 30 September 2019 Number of interns fully funded or co-funded in R&D related to design, manufacturing and product developmentNo targetNo target Number of instruments funded in support of increased localisation, competitiveness and R&Dled industry development in aerospace, advanced manufacturing, chemicals, mining, advanced metals, and ICTs, Industry Innovation Programme and the sector innovation No target No target 

181. Programme 5: Soci0-Economic Innovation Partnerships181Science and TechnologyIndicatorTarget Q2Output Q2Reason for Deviation Q2Number of highlevel research graduates (master’s and doctoral students) fully funded or co-funded in designated niche areas (advanced manufacturing, aerospace, chemicals, mining, advanced metals, ICTs, the Industry Innovation Programme and the Sector Innovation.No targetNo target -Number of industrially relevant knowledge and innovation products added to the Intellectual Property (IP) portfolio through fully funded or co-funded research initiativesAt least 4 industriallyrelevant knowledge or innovation products added to the industrial development IP ortfolio between 1 April 2019 and 30 September 2019At least 8 industrially relevant knowledge or innovation products added to the industrial development IP portfolio between 1 April 2019 and 30 September 2019 -Number of innovation-support interventions funded or cofunded that strengthen provincial or rural innovation systemsAnnual work plan approved for at least 9innovation support interventions between1 April 2019 and 30 September 2019Annual work plan approved for at least 9 innovation support interventions between 1 April 2019 and 30 September 2019 -

182. Programme 1: Administration182Small Business DevelopmentIndicatorTarget Q2Output Q2Reason for Deviation Q2Percentage compliance with MPAT standards at target levelAnnual MPAT self-assessment completed and submitted to DPME within prescribed timeframes.N/AN/APercentage over or under-expenditure on annual budget<5% expenditure on annual budget.Target Achieved:4.3% varianceN/APercentage of payments to eligible creditors processed within 30 days100% payments to eligible creditors processed within 30 days.Target Achieved:2 794 invoices worth R16 671 866.52 paid on 14 average days.N/aNumber of ICT system projects defined in the DSBD ICT Plan implementedService providers appointed for system development.Target Achieved:Specification workshops conducted.N/APercentage of female SMS representation50% of women SMS representation.Target Achieved: 54.3% (19/35)N/APercentage of PWD employed= 2% of PWD employed.Target Achieved: 2.4% - (5/207)Baseline was 3,1% on YTD i.e. 2.4% (5/207) - this has been maintained over the quarter

183. Programme 2: Sector Policy and Research183Small Business DevelopmentIndicatorTarget Q2Output Q2Reason for Deviation Q2Number of municipalities assisted to roll out Red-Tape Reduction awareness Programme.411The team works at systemic level in provinces employing the district development approach advocated by the Presidency hence this variance. Number of Local Municipal Action Plans on SMMEs and co-operatives red tape reduction assessed.12The unit works at systemic level in provinces employing the district development approach advocated by the Presidency. Number of SMMEs and co-operatives red tape reduction procedures analysed.00AchievedProposal approved.Analysis of 5 procedures completed and written-up. The assessment of the five procedures was inclusive of a review of the literature, stakeholder consultations, and position papers from specialists. An Action Plan was developed to address each of the five processes that caused red tape in access to finance and the report was written-up. Target for year completed.Submission on the amendment report on the National Small Enterprise Bill to the Minister.Draft a position paper on Institutional Arrangements. Consolidate content of position papers into a Draft Bill. Target Achieved:Consolidate contents and consult on amendments into Draft billN/A

184. Programme 2: Sector Policy and Research184Small Business DevelopmentIndicatorTarget Q2Output Q2Reason for Deviation Q2Number of Quarterly progress reports on the implementation of IR Plan.11N/AAnnual programme evaluation report on the planning, design and implementation of DSBD and Entity SMMEs financial or non-financial support programmes. Quarterly progress report on evaluation of programme undertaken.Target Achieved:Quarterly progress report on evaluation of programme undertaken.N/ASubmission on the National Accord to drive the Small Business MandateConsultations with key stakeholders on the Draft Accord conducted.AchievedInitial consultations were conducted with the 5 Provinces within the months of July and August 2019 as per the revised concept document. N/AApproved Annual Trend analysis report on 30% public procurement set asides directive for SMMEs and Co-operatives.Progress report on quarterly procurement trends in terms of 30% public procurement set asides directive for SMMEs and Co-operatives. Progress report on quarterly procurement trends in terms of 30% public procurement set asides directive for SMMEs and Co-operatives.N/A

185. Programme 3: Integrated Co-operatives Development 185Small Business DevelopmentIndicatorTarget Q2Output Q2Reason for Deviation Q2Co-operatives Development Agency (CDA) Established.Co-operatives Development Agency Proclaimed.Target not AchievedThe target has been shift to non-app in the tabled 2019/20 APPNumber of Provinces supported to align their Provincial Co-operative Strategies to the National Strategy.12N/ANumber of municipalities supported to integrate enterprise and co-operatives development and support into their Plans.Consultations with the municipalities. Consultations with the municipalitiesN/AMid-Term review of the Co-operatives StrategyInception report approved by EXCO. Inception report approved by EXCO.N/ANational Co-operative Summit convened.Provincial stakeholder consultations, leading to the National Summit, held in 6 Provinces.Provincial stakeholder consultations, leading to the National Summit, held in 6 ProvincesN/AInternational Co-operatives Day (ICD) event hosted.The International Co-operatives Day hostedThe International Co-operatives Day hostedN/A

186. Programme 3: Integrated Co-operatives Development 186Small Business DevelopmentIndicatorTarget Q2Output Q2Reason for Deviation Q2Co-operatives supported financially through the CIS to the value of the R’ millionCo-operatives supported financially through the CIS to the value of the R22 million.Co-operatives supported to the value of the R16, 98 million.N/ANumber of co-operatives supported through training.80 co-operatives supported through training. 80 co-operatives supported through training.N/ARand value of resources leveraged through partnerships with sector stakeholders per annum.R4 million secured through partnerships with sector stakeholders.R4 million secured through partnerships with sector stakeholders.N/A

187. Programme 4: Enterprise Development and Entrepreneurship187Small Business DevelopmentIndicatorTarget Q2Output Q2Reason for Deviation Q2National Entrepreneurship Development Framework. Consultations with Key Stakeholders.Consultations with Key StakeholdersN/ANumber of Informal Business Infrastructure partnership agreements secured. Three (3) Informal Business Infrastructure Partnership agreements secured.Three (3) Informal Business Infrastructure Partnership agreements secured.N/ANumber of majority black-owned SMMEs supported financially through the Black Business Support Development Programme (BBSDP) to the value of R’ million.Majority black-owned SMMEs supported financially through the BBSDP to the value of R53.8 million.SMMEs and Cooperatives supported through Blended Finance to the value of R33.3 million. No funding support was provided to SMMEs and Cooperatives in the quarter under review.Number of informal business supported through the Informal and Micro Enterprise Development Programme (IMEDP).300 informal business supported through the IMEDP.Achieved.A total of 448 informal businesses were supported in the quarter under review. N/A

188. Programme 1: Administration188TransportIndicatorTarget Q2Output Q2Reason for Deviation Q21.3.1.2 Number of Community Outreach Campaigns conducted on Gender, Disability, Youth and Children (GDYC)Conduct three (3) Community Outreach Campaigns with focus on:• Men’s Month (July); • Women’s Month (August); • Casual Day (September)Three (3) community outreach campaigns conducted as targeted• A Men Empowerment Workshop hosted in July 2019, where men in the sector deliberated on key topical issues affecting men in the country. • A Women’s Day Celebration was also hosted in August 2019. The event, attended by women in the sector, coincided with the celebration of 25 years of Democracy in South Africa and the Beijing +25 Platform of Action; and also highlighted the 65th anniversary of the Women’s Charter – focusing on human rights such as the right to vote, right to own land and property.• The Casual Day, commemorated in support of persons with disabilities, was celebrated in the first week of September 2019. None7.1.1.1 DoT Human Resources Development (HRD) Strategy Framework implemented annuallyMonitor and ensure 50% implementation of the 2019/20 HRD PlanTraining Programme:• 283 employees (231 employees and 52 interns) trained from April to September 2019. This translates to 71% of the establishment (against a target of 50% as per the Workplace Skills Plan)Bursaries: • 18 new bursaries awarded in the first intake against an annual target of 50. • 147 bursaries managedNone7.2.1.2 Implementation of the DoT Risk Management Strategy monitoredMonitor implementation of the Risk Management StrategyA monitoring report of the implementation of the Risk Management Strategy was developed as targeted.None

189. Programme 1: Administration189TransportIndicatorTarget Q2Output Q2Reason for Deviation Q27.2.1.1 Financial governance compliance and control improvedDevelop draft action plans to address audit findings and monitor progressDraft action plan to address audit findings raised by the Auditor-General (AGSA) and Internal Audit for the 2017/18 and 2018/19 financial year developed as targeted.AGSA Findings:• A total of 25 audit findings were raised. - 13 findings (52%) have been successfully addressed and closed; - 8 findings (32%) are being given adequate attention; and - 4 findings have reported inadequate progress.Internal Audit Findings:• A total of 45 audit findings were raised.None

190. Programme 2: Integrated Transport Planning190TransportIndicatorTarget Q2Output Q2Reason for Deviation Q21.1.2.1 Travel Demand Management Strategic Framework developed by March 2022Produce Inception Report for the Feasibility Study on Travel Demand Management Following the departmental Strategic Planning session in June 2019 the 2019/20 Annual Performance Plan was revised and tabled in Parliament on the 03 July 2019None1.1.2.2 Transport sector ICT Strategy approved by March 2022Conduct benchmarking exercise with existing sector ICT StrategiesA desktop benchmarking exercise on how different countries implement sector ICT strategies was conducted as targeted. Five countries were used as benchmarks for the exercise. These were Canada, United State of America (USA), United Kingdom (UK), Malaysia and Australia.None1.2.2.1 Maputo Integrated Freight Corridor Business Case implemented by March 20220Following the departmental Strategic Planning session in June 2019 the 2019/20 Annual Performance Plan was revised and tabled in Parliament on the 03 July 2019None1.2.2.2 Regional Integration Strategy submitted to Cabinet by March 2022Produce Inception Report on the development of the Regional Integration FrameworkAn inception report for the development of the Regional Integration Framework produced as targeted.None

191. Programme 2: Integrated Transport Planning191TransportIndicatorTarget Q2Output Q2Reason for Deviation Q21.3.2.1 Literature Review on the Pathway for Autonomous Vehicle Technology Implementation conducted by March 2020Conduct literature review of the detailed preparation process conducted across countries towards Autonomous Technology Vehicle implementationLiterature review on the detailed preparation process conducted across countries towards Autonomous Vehicle Technology implementation conducted as targeted and a draft report producedNone1.3.2.2 Single Transport Economic Regulator (STER) Bill submitted to Parliament by March 20210 (Progress update on STER Cabinet process)0-(STER Bill re-submitted to State Law Advisor for a legal opinion – September 2019)None

192. Programme 3: Rail Transport192 TransportIndicatorTarget Q2Output Q2Reason for Deviation Q21.5.3.1 Draft Guidelines on Rail Access Regime developed by March 2020Develop a concept document on areas to be covered in Rail Access Regime GuidelinesA concept document on areas to be covered in the Rail Access Regime Guidelines developed as targetedNone1.5.3.2 Implementation of the Branchline Model for Private Sector Participation (PSP) monitoredMonitor implementation of the PSP Framework on BranchlinesImplementation on the PSP framework monitored as targeted and a monitoring report developedNone2.1.3.1 Railway Safety Bill submitted to Cabinet by March 20200- (Cabinet processes)0 

193. Programme 4: Road Transport193TransportIndicatorTarget Q2Output Q2Reason for Deviation Q21.4.4.1 Construction and maintenance of provincial roads monitored in line with the approved budgetMonitor implementation of the SSP through site inspections, bilateral consultations and compile progress reportImplementation of the S’hamba Sonke Programme (SSP) was monitored through bilateral consultations and site visits during the period under review. In compliance with the Division of Revenue Act (DoRA), and for the administration of the applicable grant, a progress report was duly developed.None2.1.4.1 Draft Bill for Founding Legislations of Road Entities submitted to Cabinet by March 2021Conduct due diligence on the review of Founding Legislations of Road EntitiesDue diligence on the review of Founding Legislations of Road Entities conducted as targetedNone2.1.4.2 Implementation of the 2016-2030 National Road Safety Strategy monitoredConduct road safety community-based involvement in public education and awareness programs• Road Safety Education and awareness campaigns conducted in schools• Passenger and driver education and awareness campaigns conducted• Road Safety cycling education and awareness campaign conducted• Women in Traffic Law-enforcement Road Safety Dialogue hostedNone

194. Programme 4: Road Transport194TransportIndicatorTarget Q2Output Q2Reason for Deviation Q22.1.4.3 National Anti-Fraud and Corruption Strategy for Road Traffic environment submitted to Cabinet by March 2021EstablishTerms of Reference for the identified Focus GroupsTechnical specifications for the National Anti-Fraud and Corruption Forum (NAFCF) expanded to include specifications for the Focus Group, Task Team and Operational Working GroupNone2.1.4.4 Draft National Road Traffic Amendment Bill submitted to Cabinet by March 2020Submit the draft National Road Traffic Amendment Bill to the JCPS Development CommitteeDraft National Road Traffic Amendment Bill duly submitted to the JCPS Development Committee as targetedNone

195. Programme 5: Civil Aviation195TransportIndicatorTarget Q2Output Q2Reason for Deviation Q21.5.5.3 Air Services Bill submitted to Cabinet by March 2021Conduct stakeholder consultations on the Air Services BillStakeholder consultations on the Air Services Bill not conducted as targetedBill has not yet been gazetted for public comments thus impacting on the planned stakeholder consultation process.Due to a change in government administration, a directive was issued for all pipeline legislative processes to start de novo. In the instance of the Air Service Bill, the opinion of the State Law Advisor and the socio-economic impact analysis certificate need to be renewed.2.1.5.1 South African Maritime and Aeronautical Search and Rescue Amendment Bill submitted to Cabinet by March 2021Develop the draft of the South African Maritime and Aeronautical Search and Rescue Amendment BillDraft South African Maritime and Aeronautical Search and Rescue Amendment Bill developed as targetedNone5.1.5.1 Business Case for a Government-owned Aviation Academy submitted to Cabinet by March 2021Develop draft Business Case for the Government-owned Aviation AcademyDraft Business Case for the Government-owned Aviation Academy developed as targetedNone

196. Programme 6: Maritime Transport196TransportIndicatorTarget Q2Output Q2Reason for Deviation Q21.5.6.1 Programme on Maritime Education and Training Improvement developed by March 2021Conduct desktop analysis report on the state of Public Maritime Education and Training InstitutionsDesktop analysis conducted on the Durban University of Technology (DUT) and the Maritime School of Excellence (MsoE) as targetedNone2.1.6.2 State of readiness analysis for mandatory IMO audits conducted by March 2020Conduct training of Audit Team for trial auditsTraining of audit team not conducted as targetedDelays due to non-availability of IMO trainers during the period under review6.3.6.1 Marine Pollution Prevention Amendment Bill submitted to Cabinet by March 2020Submit Draft Marine Pollution Amendment Bill to NEDLAC Draft Marine Pollution Amendment Bill submitted to NEDLAC as targetedNone6.3.6.2 Maritime Energy Efficiency Programme developed by March 2020Conduct stakeholder Consultations on the concept document on Maritime Energy Efficiency Programme Stakeholder consultations conducted on the concept document of the Maritime Energy Efficiency Programme None

197. Programme 7: Public Transport197TransportIndicatorTarget Q2Output Q2Reason for Deviation Q23.1.7.1 Integrated Public Transport Network (IPTN) plans developed in district municipalities annuallyDevelop technical specifications for the development of IPTN plansTechnical specifications for the development of the IPTNs were developed for the two district municipalities as targetedNone4.1.7.1 Implementation of the Reviewed Taxi Recapitalisation Programme (RTRP) monitoredConduct survey on extent of illegal taxi operations in South Africa Survey on the extent of illegal taxi operations not conducted as targetedDuring the period under review, data from NaTIS and NLTIS was acquired and analysed. Preliminary analysis reflects a data imbalance on the number of registered vehicles for reward between the two systems. The NLTIS system shows a lower number of vehicles issued with operating licences while the NaTIS reflects a higher number of registered vehicles.Delays as a result of getting the scrapping entity (Taxi Recapitalisation SA) interfaced with eNaTISTo date the following were done:• eNaTIS connectivity and installation• Software TestingUser training is currently underway4.2.7.1 Integrated Public Transport Networks (IPTNs) funded and monitored in selected citiesConduct bilateral progress engagements with selected municipalitiesBilateral progress engagements conducted with the following cities:1. Ekurhuleni – 23 July 20192. Buffalo City – 24 July 20193. Johannesburg – 15 August 20194. Tshwane – 15 August 20195. Mangaung - 16 August 20196. Polokwane - 09 September 2019None4.3.7.1 Transport Appeal Tribunal (TAT) Amendment Bill submitted to Parliament by March 202000-Transport Appeal Tribunal (TAT) Amendment Bill approved for submission to CabinetNone

198. Programme 1: Administration198Rural Development and Land ReformIndicatorTarget Q2Output Q2Reason for Deviation Q2% of valid invoices paid within 30 days upon receipt by the department and its entities (PLAS and Deeds Trading Entities)100 %95 %The bulk of the invoices contributing relate to rates and taxes invoices.  The delays in processing these invoices was as a result of long verification process applied in ensuring the completeness and accuracy of these invoices before the payment can be processed.

199. Programme 2: Geospatial and Cadastral Services199Rural Development and Land ReformIndicatorTarget Q2Output Q2Reason for Deviation Q2Land Use Master Plan developed to facilitate effective implementation of the land reform programmeDiagnosticreportDiagnosticReport N/ANational Spatial Development Framework (NSDF) implementation strategy developedNSDFsubmission forapprovalNSDF Submission for approval N/A% of deeds made available within 7 days from lodgement for execution95 %93 %The variance is as a result of inefficiencies in workflow management. Deeds transformation policy approvedPolicyresearchreportNot AchievedNon-achievement is due to late finalisation of the Policy Discussion Document which was due in Q1 but only delivered in Q2.Number of maps of the national map series produced5356The less the features exist in a particular area the quicker it is for the maps to be produced and vice versa. The maps that were allocated for this quarter did not have much features to be added and thus the production was much faster. More maps were produced than planned.Average number of working days taken to process registerable diagrams, sectional plans and general plans1413The poor quality of work submitted still results in the high number of rejections. Staff shortages and work overloads in some offices resulted in increased turn-around times. Other offices have performed above average because some are well resourced and in some, less jobs were received from clients and which is beyond their control.Number of state land parcels surveyed3000The Department of Public Works has acquired funding from National Treasury to proceed with the same project. DRDLR will be providing Technical Support only. Therefore, there will be no reports as per the APP targets.

200. Programme 3: Rural Development200Rural Development and Land ReformIndicatorTarget Q2Output Q2Reason for Deviation Q2Number of infrastructure projects completed3845Target over achieved by 7 due to Contractors finishing earlier than expected. Number of rural enterprises supported 88110Mpu: Number of enterprises receiving inputs from the FPSUs were more than initially envisagedKZN: Delivery was brought forward by the SLA partner due to the need for fertilizer application.Number of Farmer Production Support Units (FPSUs) functional51Mpu: To fully operationalize the targeted FPSU, requires additional budget for the operations cost. The province only now identified budget for that purpose to reprioritize budget and this will be effected during Q3. There were also problems with the service provider who had to deliver seeds because of high prices. The provincial SCM is now liaising with provincial agriculture to participate in their contracts. NW and Lim: The initial target was amended to be achieved in quarter 3, but that was not corrected in time for the published APP.

201. Programme 3: Rural Development201Rural Development and Land ReformIndicatorTarget Q2Output Q2Reason for Deviation Q2number of skills development opportunities provided in rural development initiatives2103 (REID: 988, RID: 700, NARYSEC:415)2 229REID: 1196RID: 613NARYSEC: 420RID: Cumulative Targets (Q1+Q2: 1 460). Cumulative Achievements (Q1: 731+Q2: 1 009 = 1 731) Skills target was over achieved during Q1 period hence cumulative achievement is above cumulative targets. REID: GP: Tshwane: Due to the vastness of the district, training was provided to more farmers attending the grazing land management and beef cattle management training Sedibeng: Training for financial management was supposed to take place in Aug. However, service provider confirmed and trained on 9-13 September..number jobs opportunities created in rural development initiatives1661(REID: 1176; RID:485)1 540REID: 1 067RID: 473RID: Cumulative Targets (Q1+Q2: 755) . Cumulative Achievements (Q1: 390+Q2: 425 = 815)Jobs target was over achieved during Q1 period hence cumulative achievement is above cumulative target. Planned projects yielded more jobs than expected. REID: KZN: Mid-term jobs have been achieved already in Q1.NW: Implementation of projects was delayed due to Circular 54 of 2019, therefore the jobs envisaged could not be achieved. Mpu: The jobs that would have resulted from achievement in the FPSUs, could not be achieved. The jobs envisaged are seasonal, so they will be delivered in Q3. NC: Due to non-support of enterprises in Q2, identified enterprises could not create expected jobs.

202. Programme 4: Restitution202Rural Development and Land ReformIndicatorTarget Q2Output Q2Reason for Deviation Q2Number of land claims finalised169110The reasons for variance for the Q2 target, i.e. 59 claims attributed to the following:EC (2) – Grebe (1) and Bell/Jambela (1) - Payments only submitted 19/9/2019, whereas the payment process is 6 weeks. FS (5) Hetloo (1), Eerstezending (1), Harrismith (1), Senekal (2) Underreporting for Marabastad, Offer rejected by land owners; Lack of cooperation from interim chairperson during verification process (possible court referral); Reconciliation for projects to be finalised and to trace beneficiaries. Number of land claims settled13271The variance of Q2 target, i.e. 61 claims is attributed to the following: Inconsistent sitting of earmarked QCC (July 10 & 25; 1 – 14 Aug and 13 & 27 Sept 2019). Only two QCC sittings for Q2 (14 Aug and 13 Sept 2019), i.e. MP (10); KZN (18); LP (3); NC (1) and WC (10). FS (2) – lack of cooperation from interim chairperson - Eerstezending(1) and rejected offer (Groenhof / Geluksvlei (1). LP (16) – Delays in signing of settlement agreements. NC (1) – Fortune Family (1) offer rejected by family. NW (3) – Bakgatla Ba Kgafela (8 claims), the S42d earmarked for 13 Sept 2019 QCC, however routed to State land for support.

203. Programme 5: Land Care203 Rural Development and Land ReformIndicatorTarget Q2Output Q2Reason for Deviation Q2Number of hectares acquired3291711578.5212Moratorium placed by the Minister on funding of new projects. Bulk of the farms were implemented in Quarter1 hence Q1 target was over achieved by 223%Number of hectares allocated to Smallholder Farmers149632100.0634Moratorium placed by the Minister on funding of new projects. Bulk of the farms were implemented in Quarter 1 hence Q1 target was over achieved by 223%(mid-year target: 21 375 vs 22 591 Mid-year performance).Number of smallholder farmers beneficiaries allocated land325Moratorium placed by the Minister on funding of new projects. Bulk of the farms were implemented in Quarter 1 hence Q1 target was over achieved by 223%.Number of farms supported through the Land Development Support Programme5619Delays in opening of the beneficiary holding accounts to enable implementation of these projects.Number of households supported under 1HH1HA8050Slow mobilization of the projects by the Provinces due to lengthy stakeholder consultation process and disputes among the beneficiaries. Failure by Provinces to conclude projects in time leading to commitments with no new projects initiated. Number of Communal Property Associations (CPA) supported to be compliant with legislation120108The variance was due to some provinces like Northern Cape achieving their current quarterly targets under review in the previous quarter, hence the cumulative APR target has been over-achieved (Mid-year target : 198 vs 206 mid-year achievement).

204. Programme 5: Land Care204Rural Development and Land ReformIndicatorTarget Q2Output Q2Reason for Deviation Q2Number of labour tenants applications settled68623Untraceable applicants on the applications that were identified for settlement. Delays in the OVG. The deviation is also partially due to moratorium on funding of new projects. 168 applications have been approved by NLAACC during the period under review and awaiting approval by the delegated authority.Number of hectares allocated to farm dwellers and/or labour tenants18750The variance was due to a moratorium on the funding of projects (Circulars no 54 and 61 of 2019). A total of 3 201.9132 hectares to the value of R65 617 457 was approved by NLAACC and awaiting to be approved by the delegated authority in awarding land to farm dwellers and/or labour tenants as per the approved Technical Indicator Description (TIDS).

205. Independent Police Investigative DirectorateProgramme 2: Investigation and Information Management205IndicatorTarget Q2OutputQ2Reason for Deviation Q2Number of statistical reports generated as per Section 9(n) of IPID Act per year11Target met Percentage of cases allocated within 72 hours of receipt of written notification per year80 %90 %Target metNumber of investigations of deaths in police custody that are decision ready per year5063Target metNumber of investigations of deaths as a result of police action that are decision ready per year3027Cases are current and Technical Reports in this are still awaitedNumber of investigations of discharge of an official firearm by a police officer that are decision ready per year90117Target met

206. Independent Police Investigative DirectorateProgramme 2: Investigation and Information Management206IndicatorTarget Q2OutputQ2Reason for Deviation Q2Number of investigations of rape by police officer that are decision ready per year1527Target metNumber of investigations of rape while in police custody that are decision ready per year35Target metNumber of investigations of torture that a decision ready per year1518Target metNumber of investigations of assault that a decision ready per year700477Cases are still under investigationNumber of investigations of corruption that a decision ready per year207Cases are still under investigation

207. Independent Police Investigative DirectorateProgramme 2: Investigation and Information Management207IndicatorTarget Q2OutputQ2Reason for Deviation Q2Number of investigations of other criminal and misconduct matters referred to in section 28.1(h) of the IPID Act that a decision ready per year153Eight out of eleven cases reported are still under investigationNumber of investigations of offences referred to in section 33 of the IPID Act that a decision ready per year512Target metPercentage of dockets referred to the National Prosecuting Authority within 30 days of being signed off per year90 %94 %Target metPercentage of disciplinary recommendation reports referred to the South African Police Service and Municipal Police Service within 30 days of being signed off per year90 %91 %Target met

208. Independent Police Investigative DirectorateProgramme 4: Compliance Monitoring and Stakeholder Management208IndicatorTarget Q2OutputQ2Reason for Deviation Q2Number of case docket inspections conducted per yearNone22Number of community outreach events conducted per year2031Target metNumber of formal engagements held with key stakeholders per year6869Target met

209. National School of Government Programme 1 Administration209IndicatorTarget Q2OutputQ2Reason for Deviation Q2Number of days taken to collect current outstanding NSG debtsAverage number ofdays for current debtcollection at 45 daysor less from date ofdebtThe average collection days for debtors is 33 days.None.Number of days for payment of suppliers from the date of receipt of a valid invoiceAll suppliers paidwithin 30 days fromthe date of receipt ofa valid invoiceAll suppliers were paid within the prescribed 30 days..None.Achieve an unqualified or clean audit opinion by Auditor-GeneralImplement 40% ofthe current (2018/19)managementimprovement basedon AG audit findingsTarget not achieved as planned The implementation of the AG findings is underway but only 23% of targets are completed out of 13 targetsAmount of revenue generated by the Training Trading Account, as part of the cost recoveryCumulative revenueof R74m generated bythe end of September2019Cumulative projected revenue of R56 377 963generated by end of September 2019Slow uptake of training since the changes in government as a result of changes and mergers in client departments.

210. National School of Government Programme 1 Administration210IndicatorTarget Q2Preliminary Q2Reason for Deviation Q2Percentage of posts vacant by the end of financial yearVacancyrate of 10% or lessby end of the quarterVacancy rate at 12.4% (30/241) on 30 September 2019.In addition to 1 resignation, 15 posts were created on the establishment structureAverage number of days taken to resolve disciplinary casesAll disciplinary casesresolved within 60days from the date ofreceiving the case1 disciplinary case received on 5 September 2019 and the 60 days will only lapse in the 3rd Quarter. None.Effective ICT Disaster Recovery SolutionMonitor and test ICTDisaster Recoverysolution through theDisaster Recovery PlanMonitoring and testing of the ICT Disaster Recovery solution complete and the 1st Disaster Recovery Test Report developed. None.Develop the Service Delivery Model of the NSGDraft ServiceDelivery ModelCompletedThe target not achieved as planned. Finalisation of the strategy has bearing in the final Service Delivery Model for the department. Coordinate International exchange supporting capacity development interventions in the public serviceSouth African publicservants to attendCISAP trainingintervention in FranceNSG staff with CoGTA and SALGA representative attended a customised course on local governance at ENA France in July 2019.Alumni workshop was held to provide feedback on the training to CoGTA, SALGA and the NSG in August 2019. None.Provide capacity development platform for African Public Service Institutions through AMDIN initiatives Sharing of bestpractice throughlearning developmentand peer exchangePilot Curriculum forKhaedu in one countryand AfGov AnglophoneLeadership seminar held with YALI, UNISA and AMDIN in Aug 2019 covering "Innovative responses to contemporary leadership challenges in Africa" by Prof Bavon Mupenda. None.

211. National School of Government Programme 2 Public Sector Organisational and Staff Development211IndicatorTarget Q2Preliminary Q2Reason for Deviation Q2Number of research projects to inform training and development needs and opportunities completedComplete 2 researchprojects2 research projects completed. Research strategy distributed for inputs and consultation session held in September 2019.None.Number of programmes/ courses developed or reviewed annuallyNo target None.None.NSG status as an accredited training provider maintainedFacilitation of various accreditationprocesses as required by the accrediting bodiesSupported the LGSETA site verification visit. Supported the learner records meeting for LGSETA verification report in respect of the demonstration of evidence on e-learning activities.None.NSG status as an accredited training provider maintainedManage various accreditationprocesses as required by the accrediting bodiesManaged and facilitated the review of General Manager and Public Service Administrator occupational qualifications with PSETA. None.Number of online courses offered by the NSG by the end of the financial yearOffer 26 existing NSG courses foranytime, anywhere online learningOffered 26 courses for anytime, anywhere online learningNone.Number of online courses offered by the NSG by the end of the financial yearNo target None.None.

212. National School of Government Programme 2 Public Sector Organisational and Staff Development212IndicatorTarget Q2Preliminary Q2Reason for Deviation Q2Develop an implementation plan for an assessment centre in the public service Approval of selectedoption for anassessment centre Selected options for an assessment centre approved. None.Develop a diagnostic tool for a public service skills database Develop the conceptdiagnostic toolConcept diagnostic tool developed and ready for piloting. None.Number of training needs analyses completed to inform training and development needs and opportunitiesComplete 4 trainingneeds analysis(cumulative)Cumulatively 6 training needs analyses completed. Request from client departments to increase the scope of TNAs.Number of research colloquia or workshops hosted by the NSG as a knowledge sharing platformHost 3 researchcolloquia or workshops(cumulative)Hosted 4 research colloquia cumulative with 3 being hosted in second quarter.A request from Presidency to do both qualitative and quantitative research capacity building exercises.

213. National School of Government Programme 2 Public Sector Organisational and Staff Development213IndicatorTarget Q2Preliminary Q2Reason for Deviation Q2Number of articles/ papers submitted for publication to promote thought leadership, knowledge creation and disseminationNo target None.None.Number of evaluations to be carried out by end of financial yearComplete 18evaluations quarterlyNone.None.Number of application of learning studies progress reports produced by the end of financial yearProduce 7 applicationof learning studiesprogress reports(same trainingprogrammes)7 Application of Learning Studies progress reports produced. None.Number of programmes/courses quality assured annuallyQuality assure 2Programmes/courses byend of the quarterQuality Assured 6 modules of the Foundation Management Programme: 1. Citizen Centred Service Delivery 2. Self-Management 3. Operationalising Projects 4. Human Resource Practices 5. Financial Accountability6. Good GovernanceThe entire programme had to be quality assured.

214. National School of Government Programme 2 Public Sector Organisational and Staff Development214IndicatorTarget Q2Preliminary Q2Reason for Deviation Q2Number of new and current public servants trained through face to face and online learning (Including Compulsory Induction and demand led trainings)Train a cumulativeof 23 248 newand current publicservants through faceto face and onlinelearningTrained 15 168 new and current public servants through face to face and online learning Including Compulsory Induction and demand led trainings.Low uptake of courses and programmes this financial year to dateNumber of public servants trained on mandatory courses Train a cumulative of1 300 public servantson mandatory coursesCumulative 114 public servants trained on mandatory courses.Delays in concluding bilateral agreements with departments and provinces on the implementation of compulsory courses.Number of unemployed graduates and internships undergoing public service orientation through the NSG Orientate a cumulative of 2000unemployed graduatesthrough youthdevelopment/ BB2EProgrammesCumulative 1 021 unemployed youth graduates and interns trained. Delays caused by bulk booking as departments are operating under cost containment and availability of facilitators when schedules allow. Professionalised training facilitator recruited as part as part of Rutanang Ma Afrika initiatives (including Independent Individual Contractors as well as serving and retired 1 Training of Trainers(TOTs) or TrainerLearners Networks(TLNs) held by theend of the quarter6 Training of Trainers (TOTs) Trainers Learning Networks (TLNs) held by the end of the quarter.Each training stream hosted their ToTs due to the increasing need to have trainer’s quality improved for better service provision. Number of memorandum of agreement (MOAs) signed with the public sector departments and other organs of the state Sign 5 MOAs with the public sector departments and other organs of the state(cumulative)Cumulative 4 MOAs with the public sector departments and other organs of the state signed.Administrative delays led to deferral in the signing of pending MOAs.

215. Office of Chief JusticePROGRAMME 1: ADMINISTRATION215IndicatorTarget Q2OutputQ2Reason for Deviation Q21.1. Annual Performance Plan compliant with the national prescripts and tabled within prescribed timelines1st draft Annual Performance Plan (2020/21) compliant with the national prescripts submitted to DPME and NT1st draft Annual Performance Plan (2020/21) compliant with the national prescripts not submitted to DPME and NTThe target was set based on the old Framework for Strategic Plans and APP. However, during the 2019/20 financial year DPME indicated that departments must develop the plans using the new draft framework for Strategic Plans and Annual Performance Plans which only require a submission of the draft APP at the end of October. 1.2 Combined Assurance Plan implementedCombined Assurance Plan implemented in 8 Superior Courts Combined Assurance Plan implemented in 24 Superior CourtsThe combined effort by three Units i.e. IA, M&E and Court Admin assisted in coverage of more Superior Courts1.3 Number of Strategic and Operational risk registers reviewed/ updated 22None

216. Office of Chief JusticePROGRAMME 1: ADMINISTRATION216IndicatorTarget Q2OutputQ2Reason for Deviation Q21.4 OCJ Fraud Prevention Strategy implemented Fraud Prevention Strategy implemented in 8 Superior CourtsFraud Prevention Strategy implemented in 8 Superior CourtsNone ICT Master Systems Plan implemented over the MTEF E-filling project pilotedThe caseline pilot has been a success. However, the e-filing project was not fully piloted.The OCJ has raised a dispute with SITA with regards to the e-filing project being piloted as requested. 1.1. Percentage of internal audit projects completed in line with the approved Annual Audit Plan 100 %100 %None1.3. Number of asset registers produced in line with the prescripts 11None

217. Office of Chief JusticePROGRAMME 2: SUPERIOR COURT SERVICES217IndicatorTarget Q2OutputQ2Reason for Deviation Q22.1. Percentage achievement of quasi-judicial targets100 %96 %Number of applications queried by Registrars 2.2. Number of monitoring reports on Court Order Integrity Project produced11None2.3. Percentage of default judgments finalised by Registrars per year100 %94 %Number of applications queried by Registrars2.4. Percentage of taxations of legal costs finalised per year100 %99 %Number of applications queried by Registrars2.5. Percentage of warrants of release (J1) delivered within one day of the release issued98 %100 %Improved training and monitoring measures implemented to sustain achievements of targets

218. Office of Chief JusticePROGRAMME 3: JUDICIAL EDUCATION AND SUPPORT218IndicatorTarget Q2OutputQ2Reason for Deviation Q23.1. Number of judicial education courses conducted per year3544Target exceeded due to ad-hoc requests and needs submitted by Chief Magistrates 3.2. Number of research monographs on judicial education produced per year11None Percentage of legal advisory opinions on policy development and research services provided within 15 working days of receipt 100 %100 %None

219. NATIONAL TREASURY Programme 1: Administration219IndicatorTarget Q2OutputQ2Reason for Deviation Q21.2.2 Number of quarterly risk implementation assessment reports produced11N/A1.2.3 Number of quarterly reports on monitored performance of entities reporting to MOF 11N/A1.2.4 Percentage of Corporate Governance of ICT Program implemented5 %5 %N/A1.2.1 Percentage of the approved risk-based IA plan completed100 %53 %Under-performance is attributed to the cessation of the utilisation of the external service providers to augment available IA unit resources due to AGSA finding.1.1.1 Percentage of Enterprise Architecture Programme implemented3 %3 %N/A

220. NATIONAL TREASURY Programme 2: Economic Policy, Tax, Financial Regulation and Research220IndicatorTarget Q2OutputQ2Reason for Deviation Q22.3.1 Publish tax proposals in annual budget review Publish revenue forecasts in MTBPS.Published revenueforecasts in MTBPSN/A2.3.2 Implement legislation to give effect to tax proposals from the BudgetPublish draft tax legislation.Published draft taxlegislation.N/A2.4.1 Number of economic models maintained55N/A2.4.2 Number of economic forecasts developed11N/A2.4.4 Percentage response to user requests to develop new economic models100 %100 %No requests received in this quarter.

221. NATIONAL TREASURY Programme 2: Economic Policy, Tax, Financial Regulation and Research221IndicatorTarget Q2OutputQ2Reason for Deviation Q22.4.5 Percentage response to users requests for economic research and policy analysis, and assessments of government policy proposals100 %100 %N/A2.4.6 Percentage response to user requests for policy and scenario modeling100 %100 %N/A2.4.7 Percentage response to user requests for commentaries on economic data100 %100 %N/A2.1.1 Number of papers published through the SA-TIED programme 1236Over-performance is attributed to enhanced efficiency and increased work schedule in the publication of papers by the SA-TIED programme2.2.2 Develop savings and retirement policiesCommence the application of minimum training standards for retirement fund trustees.Application ofminimum trainingstandards forretirement fundtrustees commenced.N/A

222. NATIONAL TREASURY Programme 3: Public Finance and Budget Management222IndicatorTarget Q2OutputQ2Reason for Deviation Q23.2.1 Number of budget guidelines issued 1 MTEF guideline.1 AENE guideline.1 MTEF guideline.1 AENE guidelineN/A3.3.2 Number of reports produced on public finance statistics according to function and economic classification 11N/A3.3.3 Number of reports produced on guidance given to departments and entities on the classification of expenditure11N/A3.4.1 Percentage responses to departmental requests for PFMA and TR approvals, sectoral analysis and policy advice100 %91.4 %Delays in getting responses from departments/entities on clarity seeking questions.

223. NATIONAL TREASURY Programme 3: Public Finance and Budget Management223IndicatorTarget Q2OutputQ2Reason for Deviation Q23.4.7 Percentage of Budget Facility on Infrastructure (BFI) projects evaluated100 %100 %N/A3.5.1 Percentage alignment of development cooperation to government policy and priorities100 %100 %N/A3.6.1 Number of Division of Revenue and Division of Revenue Amendment Bills published annually00N/A3.6.5 Number of capacity building initiatives to facilitate improved planning, budgeting and financial management1918This target was amended to 18.

224. NATIONAL TREASURY Programme 3: Public Finance and Budget Management224IndicatorTarget Q2OutputQ2Reason for Deviation Q23.6.6 Number of quarterly financial reports published 22N/A3.6.9 Number of support initiatives implemented in provinces 11N/A3.4.2 Percentage of Cabinet memos commented on100 %100 %N/A3.4.5 Number of reports produced on review and implementation of the COLA costing model11N/A3.5.2 Percentage of development cooperation projects in South Africa coordinated 100 %100 %N/A

225. NATIONAL TREASURY Programme 4: Asset and Liability Management225IndicatorTarget Q2OutputQ2Reason for Deviation Q24.1.1 Percentage of complete corporate plans received from Schedule 2 and 3B public entities reviewed 100 %100 %N/A4.1.6 Percentage of complete remuneration review requests of executive and non-executive directors received from Schedule 2 and 3B public entities reporting to the Minister of Finance reviewed 100 %100 %N/A4.1.8 Percentage of complete review requests of borrowing limit applications relating to Schedule 2 and 3B public entities reviewed100 %100 %N/A4.2.1 Percentage of government’s annual gross borrowing requirement met100 %100 %N/A

226. NATIONAL TREASURY Programme 4: Asset and Liability Management226IndicatorTarget Q2OutputQ2Reason for Deviation Q24.2.2 Percentage of interest and redemptions met100 %100 %N/A4.3.1 Percentage of government’s liquidity requirements met100 %100 %N/A4.4.1 Percentage compliance with market and refinancing risks benchmarks100 %100 %N/A4.4.2 Number of interactions to manage and ensure effective relations with the credit rating agencies22N/A4.4.3 Number of reports on the management of government’s contingent liabilities and counterparty risk22N/A4.1.3 Percentage of complete PFMA Section 51(g), 52, 54(2), 55, and 92 applications received from Schedule 2 and 3B public entities reviewed100 %85.7 %Under-performance is attributed to the greater stakeholder consultations required with Denel and the Department of Public Enterprises.4.1.7 Percentage of complete board appointments recommendations received from Schedule 2 and 3B public entities reporting to the Minister of Finance reviewed100 %100 %N/A

227. NATIONAL TREASURY Programme 5: Financial Accounting and Supply Chain Management Systems227IndicatorTarget Q2OutputQ2Reason for Deviation Q25.2.1 Number of training sessions conducted in the preparation of provincial consolidated financial statements, provincial revenue fund statements and implementation of Generally Recognised Accounting Practice (GRAP) standards11N/A5.2.2 Percentage of the public financial management education, training and development implementation plan achieved25 %25 %N/A5.2.3 Number of municipal officials trained in financial management competencies250250N/A5.2.4 Percentage of the public financial management capacity development strategy (CDS) implementation plan achieved25 %25 %N/A5.2.5 Percentage of qualifying trainees that participate in the academic support programme for prospective chartered accountants100 %100 %N/A

228. NATIONAL TREASURY Programme 5: Financial Accounting and Supply Chain Management Systems228IndicatorTarget Q2OutputQ2Reason for Deviation Q25.4.1 Number of Instructions issued in line with policy interventions and proposed designated products or categories to enhance SCM policy13Over-performance is attributed to an immediate need to address possible irregular experience for non-compliance with the instruction.5.5.1 Percentage of departments’/entities’ deviation/expansion requests reviewed100 %77 % Under-performance is attributed capacity constraints.5.5.2 Percentage of procurement plans published on the e-tender portal100 %100 %N/A5.5.3 Percentage of bids reviewed to ensure compliance with norms and standards100 %65 %Under-performance is attributed to capacity constraints.5.4.1 Number of Instructions issued in line with policy interventions and proposed designated products or categories to enhance SCM policy13Over-performance is attributed to an immediate need to address possible irregular experience for non-compliance with the instruction.

229. NATIONAL TREASURY Programme 5: Financial Accounting and Supply Chain Management Systems229IndicatorTarget Q2OutputQ2Reason for Deviation Q25.6.1 Percentage implementation of the strategic sourcing opportunities plan100 %92 %Under-performance is attributed to a delay in drafting the specifications of one commodity due to its complexity.5.6.2 Number of transversal term contracts implemented711Extensions of contracts that were expiring as an alternative sourcing strategy in order to allow departments access to goods and services in these contracts whilst finalising bid specifications for new the contracts.5.1.1 Number of support plans developed for government entities struggling with financial management as identified in audit reports34Over-performance is attributed to high demand emanating from the work that was done with the entities from the previous financial year5.6.1 Percentage implementation of the strategic sourcing opportunities plan100 %92 %Under-performance is attributed to a delay in drafting the specifications of one commodity due to its complexity.

230. NATIONAL TREASURY Programme 5: Financial Accounting and Supply Chain Management Systems230IndicatorTarget Q2OutputQ2Reason for Deviation Q25.1.2 Number of monitoring reports on improvement of financial management in national and provincial institutions produced11N/A5.1.3 Number of guidelines to assist with the implementation of Treasury Regulations, policies and Treasury Instructions developed11N/A5.1.4 Number of training sessions provided to support PFMA institutions on the implementation of Treasury Regulations, Treasury Instructions and guidelines211Over-performance is attributed to the rollout of the revised irregular expenditure framework requiring more training sessions than anticipated.5.1.5 Number of forensic investigation reports produced719Over-performance is attributed to efficient responses to increased demand.

231. NATIONAL TREASURY Programme 5: Financial Accounting and Supply Chain Management Systems231IndicatorTarget Q2OutputQ2Reason for Deviation Q25.1.10 Percentage of complete requests to draft financial recovery plans responded to within 90 days of receipt 100 %100 %N/A5.1.13 Number of monthly statement reports of actual revenue and actual expenditure for the National Revenue Fund (NRF) published 33N/A5.8.1 Number of municipalities supported in SCM and contract management audit findings/opinions; monitoring corrective actions taken by non-compliant municipalities416Over-performance is attributed to an increased demand for support by the municipalities and proactiveness in identifying municipalities that require support.

232. NATIONAL TREASURY Programme 6: International Financial Relations232IndicatorTarget Q2OutputQ2Reason for Deviation Q26.1.1 Percentage of obligations towards international agreements met monitored100 %100 %N/A6.2.2 Percentage of interventions in pursuit of institutional reform implemented100 %100 %N/A6.1.2 Percentage response to customer requests on mandatory briefing notes and analyses100 %100 %N/A6.1.3 Percentage response to customer requests on ad-hoc briefing notes and analyses100 %100 %N/A6.3.2 Percentage of implemented identified plans to accelerate regional integration reviewed100 %100 %N/A

233. NATIONAL TREASURY Programme 7: Civil and Military Pensions, Contributions to Funds and Other Benefits233IndicatorTarget Q2OutputQ2Reason for Deviation Q27.1.1 Percentage of benefits validated for payment paid within liable dates96 %99.9 %Over-performance is attributed to effective and efficient administration of Programme 7 funds.7.1.2 Percentage compliance with SLA between NT and GPAA specifically Programme 7 related indicators97.5 %100 %Over-performance is attributed to effective and efficient management of Programme 7 service levels.7.1.3 Percentage integrity of client data85 %99.9 %Over-performance is attributed to continuous monitoring and management of client data. 7.2.1 Percentage of customer service complaints responded to within seven days of receipt100 %100 %N/A

234. DEPARTMENT OF TOURISMPROGRAMME 1: ADMINISTRATION (CORPORATE MANAGEMENT)234IndicatorTarget Q2OutputQ2Reason for Deviation Q2PPI 2: Vacancy rateVacancy rate not to exceed 10% of the funded establishmentVacancy rate was maintained at 9.1%-PPI 6: Percentage implementation of the communication strategy 100% implementation of the quarter two requirements of the annual implementation plan of the department’s communication strategy81% of the quarter two requirements of the annual implementation plan of the department’s communication strategy was implemented.• Staff Imbizo postponed to early 2020 due to availability of management • The production of Annual Report was delayed because the audit report only became available on the 30th September. PPI 7: Percentage procurement of goods and services from B-BBEE compliant businesses and SMMEs100% of expenditure achieved on procurement from enterprises on B-BBEE contributor status levels 1 to 5100% of expenditure was achieved on procurement from enterprises on B-BBEE contributor status levels 1 to 5-

235. DEPARTMENT OF TOURISMPROGRAMME 1: ADMINISTRATION (CORPORATE MANAGEMENT)235IndicatorTarget Q2OutputQ2Reason for Deviation Q2PPI 3: Percentage compliance with equity targets in terms of departmental Employment Equity Plan- Women representationMaintain minimum of 50% women representation at SMS levelWomen representation at SMS level was maintained at 45.8%The appointment of more males at SMS level at Ministry led to the decline in female representativity at SMS levelPPI 3: Percentage compliance with equity targets in terms of departmental Employment Equity Plan- People with disabilitiesMaintain minimum of 3% people with disabilities representationPeople with disabilities' representation was maintained at 4.4%-PPI 3: Percentage compliance with equity targets in terms of departmental Employment Equity Plan- Black representationMaintain minimum of 91.5% Black representationBlack representation was maintained at 95.8%-PPI 7: Percentage procurement of goods and services- SMMEs from B-BBEE compliant businesses and SMMEsMinimum 30% expenditure achieved on procurement of goods and services from SMMEs47% expenditure on procurement of goods and services from SMMEs was achieved-

236. DEPARTMENT OF TOURISM PROGRAMME 2: TOURISM RESEARCH, POLICY AND INTERNATIONAL RELATIONS236IndicatorTarget Q2OutputQ2Reason for Deviation Q2PPI 1: Development of Policy Framework to support SA Missions for tourism development and promotionConsultation on draft Policy framework for the SA Missions’ tourism promotion and facilitation support commencedConsultation on draft Policy framework for the SA Missions’ tourism promotion and facilitation support has commenced-PPI 2: Number of monitoring and evaluation reports on tourism projects and initiatives developedData collection and drafting of the NTSS Implementation Report initiatedData collection and drafting of the NTSS Implementation report was initiated-PPI 3: Number of sub-systems developed and maintained for the National Tourism Information and Monitoring SystemData verified and imported into the databaseImporting of data and verification was not conductedData collection was not conducted due the delay in procurement of uniform and internet required to commence with collection of dataPPI 4: Number of Information dissemination platforms hosted • Concept document on the 2019/20 Tourism Research Seminar developed • Implementation plan for the 2019/20 Tourism Research Seminar developed• Concept document on the 2019/20 Tourism Research Seminar was developed• Implementation plan for the 2019/20 Tourism Research Seminar was developed-

237. DEPARTMENT OF TOURISM PROGRAMME 2: TOURISM RESEARCH, POLICY AND INTERNATIONAL RELATIONS237IndicatorTarget Q2OutputQ2Reason for Deviation Q2PPI 5: Number of initiatives conducted to promote innovation in the tourism sectorProposal on the Digitalisation framework developedProposal on the Digitalisation framework was developed-PPI 6: Number of initiatives facilitated for regional integrationStakeholder engagement in preparation for the Best Practices Workshop conductedStakeholder engagement in preparation for the Best Practices Workshop was conducted-PPI 2: Number of monitoring and evaluation reports on tourism projects and initiatives developed- 2017/18 STRPublish 2017/18 STR2017/18 STR was not published2017/18 STR has been finalised and is still awaiting approval for publishingPPI 2: Number of monitoring and evaluation reports on tourism projects and initiatives developed- 2018/19 STR developedData collection for 2018/19 STR commencedData collection for the draft 2018/19 STR has commenced-PPI 2: Number of monitoring and evaluation reports on tourism projects and initiatives developed- Impact evaluation reportQuarterly Tourism Performance Report developedQuarterly Tourism Performance Report was developedPPI 3: Number of sub-systems developed and maintained for the National Tourism Information and Monitoring System (NTIMS)- Enterprise Development and Transformation PortalProgress report on data collection developedProgress Report on data collection was developed

238. DEPARTMENT OF TOURISM PROGRAMME 2: TOURISM RESEARCH, POLICY AND INTERNATIONAL RELATIONS238IndicatorTarget Q2OutputQ2Reason for Deviation Q2PPI 6: Number of initiatives facilitated for regional integration- Signed bilateral agreementsDevelopment of Enterprise Development and Transformation Portal commencedDevelopment of Enterprise Development and Transformation Portal has commencedPPI 2: Number of monitoring and evaluation reports on tourism projects and initiatives developed- Impact evaluation reportQuarterly report on the implementation of prioritised areas in the bilateral agreements developedQuarterly report on the implementation of prioritised areas in the bilateral agreements developed

239. DEPARTMENT OF TOURISMPROGRAMME 3: DESTINATION DEVELOPMENT239IndicatorTarget Q2OutputQ2Reason for Deviation Q2PPI 1: Number of destination planning and investment coordination initiatives undertakenStakeholder consultation sessions for the Tourism Master Plan for Port Nolloth to Hondeklipbaai completedStakeholder consultation sessions for the Tourism Master Plan for Sutherland to Carnarvon were completed on 27 and 28 August 2019PPI 2: Number of destination enhancement initiatives supportedStoryline for interpretative signage for the Kruger National Park developedStoryline for interpretative signage for the Kruger National Park was developedPPI 3: Number of FTE jobs created through Working for Tourism projects 1082 Full Time Equivalent Jobs created1 218 FTE jobs were created through the Working for Tourism ProgrammePPI 1: Number of destination planning and investment coordination initiatives undertaken- Tourism master plan for Sutherland to CarnarvonStakeholder consultation sessions for the Tourism Master Plan for Sutherland to Carnarvon completedStakeholder consultation sessions for the Tourism Master Plan for Sutherland to Carnarvon were completed on 27 and 28 August 2019

240. DEPARTMENT OF TOURISMPROGRAMME 3: DESTINATION DEVELOPMENT240IndicatorTarget Q2OutputQ2Reason for Deviation Q2PPI 1: Number of destination planning and investment coordination initiatives undertaken- Tourism master plan for Port St Johns to Coffee BayStakeholder consultation sessions for the Tourism Master Plan for Port St Johns to Coffee Bay completedStakeholder consultation sessions for the Tourism Master Plan for Port St Johns to Coffee Bay were conducted as follows:• Mthatha -16 September 2019;• Mbizana -17 September 2019;• Port St Johns - 18 September 2019; and• Coffee Bay - 19 September 2019-PPI 1: Number of destination planning and investment coordination initiatives undertaken- Budget resort network and brand conceptFramework for a budget resort network and brand completedFramework for a budget resort network and brand was not completed, however, an inception report was finalisedProject slightly delayed due to Departmental Bid Adjudication Committee's recommendation to seek approval to augment the budget, which has been securedPPI 1: Number of destination planning and investment coordination initiatives undertaken- Develop content and facilitate a session per ProvinceContent for the niche tourism facilitation sessions developedContent for the niche tourism facilitation sessions was not developed, however, an inception meeting was held and inception report finalisedAppointment process delayed to allow the incorporation of inputs from multiple procurement CommitteesPPI 1: Number of destination planning and investment coordination initiatives undertaken- A pipeline of nationally prioritised tourism investment opportunities Quarterly Report on the management of a pipeline of nationally prioritised tourism investment opportunitiesQuarterly Report on the management of a pipeline of nationally prioritised tourism investment opportunities was developed-

241. DEPARTMENT OF TOURISMPROGRAMME 3: DESTINATION DEVELOPMENT241IndicatorTarget Q2OutputQ2Reason for Deviation Q2PPPI 2: Number of destination enhancement initiatives supported- Golden Gate Highlands National ParkStoryline for interpretative signage for the Golden Gate Highlands National Park developedStoryline for interpretative signage for the Golden Gate Highlands National Park was developedPPPI 2: Number of destination enhancement initiatives supported- Kgalagadi World heritage Site (WHS)Storyline for interpretative signage for the Kgalagadi WHS developedStoryline for interpretative signage for the Kgalagadi WHS was developedPPPI 2: Number of destination enhancement initiatives supported- Marakele National ParkStoryline for interpretative signage for the Marakele National Park developedStoryline for interpretative signage for the Marakele National Park was developedPPPI 2: Number of destination enhancement initiatives supported- Addo Elephant National ParkDevelopment of storyline and interpretative signage design the Addo Elephant National ParkStoryline for interpretative signage for the Addo Elephant National Park was developed

242. DEPARTMENT OF TOURISMPROGRAMME 3: DESTINATION DEVELOPMENT242IndicatorTarget Q2OutputQ2Reason for Deviation Q2PPPI 2: Number of destination enhancement initiatives supported- Construction of the Leopard Trail in BaviaanskloofContractor appointed for the Leopard Trail in Baviaanskloof (Cape Floral Region WHS)A Contractor for the Leopard Trail in Baviaanskloof (Cape Floral Region WHS) was not appointed-PPPI 2: Number of destination enhancement initiatives supported- Appointment of contractor for the construction of the VICEnvironmental Impact Assessment (EIA) application finalised for the VIC in Baviaanskloof (Cape Floral Region WHS)Environmental Impact Assessment (EIA) application for the VIC in Baviaanskloof (Cape Floral Region WHS) was developed and submitted to the Department of Environment, Forestry and Fisheries for finalisationDepartment of Environment, Forestry and Fisheries (DEFF) is still reviewing the EIAPPPI 2: Number of destination enhancement initiatives supported- Construction for the Dinosaur Interpretation Centre at the Golden Gate Highlands National ParkQuarterly Report on the implementation of the construction as per work schedule for Dinosaur Interpretation CentreQuarterly Report on the implementation of the construction as per work schedule for Dinosaur Interpretation Centre was developed-PPPI 2: Number of destination enhancement initiatives supported- Contractor appointed for Shangoni GateDetailed designs for Shangoni Gate finalisedDetailed designs for Shangoni Gate were not finalisedThere were delays in finalisation of Geotech studies

243. DEPARTMENT OF TOURISMPROGRAMME 3: DESTINATION DEVELOPMENT243IndicatorTarget Q2OutputQ2Reason for Deviation Q2PPPI 2: Number of destination enhancement initiatives supported- Finalisation of designs for the Hole in the WallAppointment of service provider to develop plans for the Hole in the Wall (Eastern Cape) as a CMT initiativeAppointment of service provider to develop plans for the Hole in the Wall (Eastern Cape) as a CMT initiative was not done, however, stakeholder engagements were conducted in OR Tambo District Municipality and COEGA has been identified as the suitable service providerThere were delays in the approval for the appointment of Coega to do the designsPPI 2: Number of destination enhancement initiatives supported- Finalisation of designs for the Orange River MouthAppointment of service provider to develop plans for the Orange River Mouth (Northern Cape) as a CMT initiativeAppointment of service provider to develop plans for the Orange River Mouth (Northern Cape) as a CMT initiative was not done, however, stakeholder engagements were conducted in Port Nolloth. There were delays in the approval for the appointment of Coega to do the designsPPI 2: Number of destination enhancement initiatives supported- Implementation of the infrastructure maintenance programme in two national parks Support implementation of infrastructure maintenance works in two national parks (Golden Gate Highlands National Park, Kgalagadi National Park)Support implementation of infrastructure maintenance works in two national parks (Golden Gate Highlands National Park, Kgalagadi National Park) was done-PPI 2: Number of destination enhancement initiatives supported- Implementation of the Tourism Blue Flag ProgrammeRecruitment and contracting of the participants into the Tourism Blue Flag ProgrammeRecruitment and contracting of the participants into the Tourism Blue Flag Programme was not doneThere was a delay in the transferring of planning funds to the service provider

244. DEPARTMENT OF TOURISMPROGRAMME 3: DESTINATION DEVELOPMENT244IndicatorTarget Q2OutputQ2Reason for Deviation Q2PPI 1: Number of awareness sessions hostedOne Local Government Tourism Peer Learning Network session for municipal practitioners conductedOne Local Government Tourism Peer Learning Network session for municipal practitioners was conducted in Durban on 14-15 August 2019-

245. DEPARTMENT OF TOURISMPROGRAMME 4: TOURISM SECTOR SUPPORT SERVICES245IndicatorTarget Q2OutputQ2Reason for Deviation Q2PPI 2: Number of incentivised programmes implemented- MASPApplications and claims for MASP approved13 applications were approved for the Market Access support programmePPI 2: Number of incentivised programmes implemented- GTIPApplications for the GTIP approved9 Applications for GTIP were approved in the following provinces:• Eastern Cape (2)• Gauteng (3)• Free State (1)• Western Cape (3)PPI 2: Number of incentivised programmes implemented- TTFApplications for the TTF approvedTwo applications for the TTF were approved.-PPI 2: Number of incentivised programmes implemented- TEFApplications for the TEF openedApplications for the TEF were not openedThe IDC and departmental officials are still working on finalising the scoring model and concept document and therefore applications for the TEF have not yet been opened

246. DEPARTMENT OF TOURISMPROGRAMME 4: TOURISM SECTOR SUPPORT SERVICES246IndicatorTarget Q2OutputQ2Reason for Deviation Q2PPI 3: Number of initiatives implemented to support Domestic Tourism Growth Strategy- designated groupsOne initiative for designated group supportedOne initiative for designated group was not supportedLack of direction on the nature of concepts and how the programme should be implemented (three different concept documents done, but none were approved or finalised)PPI 3: Number of initiatives implemented to support Domestic Tourism Growth- tourism Month Campaign Strategy- Implementation of Tourism Month campaign initiatives in conjunction with Provinces (World Tourism Day celebrations)Tourism Month campaign initiatives in conjunction with Provinces (World Tourism Day celebrations) was implemented on 27 September 2019 in KwaZulu-Natal-PPI 4: Number of enterprise development initiatives implemented- Community based enterprises• Service provider to conduct a feasibility study for the development and support of the community based enterprises • Stakeholder consultation continued• Service provider to conduct a feasibility study for the development and support of the community based enterprises was not appointed• Stakeholder consultation continued as follows.- Kruger National Park -7 and 8 August 2019;- Augrabies Falls National -14 and 15 August 2019; - Addo Elephant Park - 22 August 2019;- Golden Gate National - 26 and 27 August 2019;- Marakele National Park30 August 2019Delays in finalising workstreams in quarter 1 impacted on the finalisation of Terms of reference and the appointment of a service provider

247. DEPARTMENT OF TOURISMPROGRAMME 4: TOURISM SECTOR SUPPORT SERVICES247IndicatorTarget Q2OutputQ2Reason for Deviation Q2PPI 5: Number of initiatives for improving visitor services implemented- Tourism Monitors ProgrammeTourism Monitors Programme implemented in all provincesTourism Monitors Programme implemented in 7 provincesThe programme was not implemented in two provinces due to the following reasons:Eastern Cape (EC):Classroom training for the beneficiaries has been suspended due to lack of funds for transport and accommodation.North West (NW):The programme was in planning phasePPI 5: Number of initiatives for improving visitor services implemented- Tourism Monitors ProgrammeTourism Monitors Programme implemented in all provincesTourism Monitors Programme implemented in 7 provincesThe programme was not implemented in two provinces due to the following reasons:Eastern Cape (EC):Classroom training for the beneficiaries has been suspended due to lack of funds for transport and accommodation.North West (NW):The programme was in planning phasePPI 6: Number of capacity-building programmes implemented- Executive Development ProgrammeContinuous training of 20 Black women undertaken at an institution of higher learningContinuous training of 18 Black women undertaken at an institution of higher learning was conducted-

248. DEPARTMENT OF TOURISMPROGRAMME 4: TOURISM SECTOR SUPPORT SERVICES248IndicatorTarget Q2OutputQ2Reason for Deviation Q2PPI 6: Number of capacity-building programmes implemented- Mentorship pilot ProgrammeMonitor Pilot of the mentorship programmePiloting of the mentorship programme was not monitoredThere is a meeting on 9 October 2019 to adjudicate on proposed project for funding and the department is awaiting for a feedback from TBSCA BoardPPI 1: Number of awareness sessions hosted- Tourism Information Sharing SessionsTourism Information sharing sessions on departmental programmes and services hosted in one provinceTourism Information sharing sessions on departmental programmes and services in one province was hosted in Beaufort West and Caledon on 20 and 22 August 2019-

249. Office of the Public Service Commission249Programme 1: AdministrationIndicatorTarget Q2Output Q2Reason for Deviation Q2Number of risk management reports produced quarterly11NoneNumber of interim financial statements submitted to NT quarterly11NonePercentage of valid invoices paid within 30 days of receipt100 %100 %NoneApproved Annual Performance Plan tabled in Parliament by 31 March 20201st draft Annual Performance Plan submitted to NT & DPME on 31 August 2019No draft submitted due to revised timelines by DPME as per Revised FrameworkTarget due in Q3 as per revised FrameworkNumber of communique on grievance management produced by March 201911NoneNumber of reports on the management of grievances in the public service produced111st Technical Brief produced in September 2019

250. Office of the Public Service CommissionProgramme 2: Leadership and Management Practices250IndicatorTarget Q2Output Q2Reason for Deviation Q2Percentage of investigations on grievances of employees on salary level 2-12 concluded within 30 working days from date of receipt of all relevant information50 %53 %NonePercentage of investigations on grievances of SMS members concluded within 45 working days from date of receipt of all relevant information50 %91 %NoneNumber of CVP engagements held319More demand for the engagements resulted in the Office conducting more engagementsProgramme 3: Monitoring and EvaluationThere are no targets for quarter 1 and 2Performance will be measured in quarter 4

251. Office of the Public Service CommissionProgramme 4: Integrity and Anti-Corruption251IndicatorTarget Q2Output Q2Reason for Deviation Q2Percentage of NACH cases referred within 7 days of receipt of case reports90 %100 %Target exceeded due to improvements in efficienciesPercentage of public administration investigations finalised within 3 months upon receipt of all relevant information45 %94 %Target exceeded due to compliance monitoring of business processesPercentage of investigation on early resolution cases finalised within 45 working days upon receipt of all relevant information90 %100 %Target exceeded due to compliance monitoring of business processes

252. Property Management Trading EntityProgramme 1: Administration252IndicatorTarget Q2Output Q2Reason for Deviation Q2Percentage of compliant invoices settled within 30 days 100% of compliant invoices settled within 30 days 86Clients department do not confirm funds timeouslyPercentage of bids awarded within 56 working days of closure of tender advertisement65% of bids awardedwithin 56 working days of closure of tender advertisement33% (26 of 78Delays of clients departments in confirming fundsPercentage of quotations awarded within 30 working days from requisition date80% of quotationsawarded within 30working days fromrequisition date74% (1599 of 2191)some quotations are advertised for longer period in regionsPercentage of procurement spend for bids awarded to designated groups in line with Preferential Procurement Regulations 201780% of procurement spend for bids awarded to designatedgroups in line with Preferential Procurement Regulations 201787% (A total rand of 432 984 216,03out of 558 124 658,80 bids were awarded to designated groups) not providedPercentage of bids awarded to designated groups in line with Preferential Procurement Regulations 201780% of bids awardedto designated groups in line with Preferential Procurement Regulations 201783% (A total rand of 65 out of 78 bids were awarded to designated groups 

253. Property Management Trading EntityProgramme 2: Real Estate Investment Services253IndicatorTarget Q2Output Q2Reason for Deviation Q2Number of Government Precinct Development plans aligned with identified municipal (urban and rural) Integrated Development Plans (IDPs)1 GovernmentPrecinct DevelopmentPlans aligned withidentified (urban andrural) municipal IDPs1 Government precinct development plan aligned with municipal IDP Number of sites established for development1 sites established fordevelopment1 site established for development  Number of concept designs completed for identified user departments2 concept designscompleted foridentified userdepartments2 concept designs completed for identified user departments Percentage of feasibility studies completed within scheduled timeframes90% feasibilitystudies completedwithin scheduledtimeframes100%deviation not providedPercentage of valuations completed within scheduled timeframes90% valuationscompletedwithin scheduledtimeframes118%deviation not providedNumber of facilities performance measured in identified performance areas200 facilitiesperformancemeasuredin identifiedperformance areas227deviation not provided

254. Property Management Trading EntityProgramme 3: Construction Project Management254IndicatorTarget Q2Output Q2Reason for Deviation Q2Number of approved infrastructure project designs 2647Improved monitoring during Project review meetingsNumber of approved infrastructure projects ready for tender4052Improved monitoring during Project Review meetingNumber of infrastructure sites handed over for construction3330Late approval and confirmation of funds by the User ClientsNumber of infrastructure projects completed5863Increased monitoring Number of infrastructure projects completed within agreed construction period4637Late approval and confirmation of funds by the User Clients and poor performing contractorsNumber of infrastructure projects completed within approved budget4652Increased monitoringNumber of EPWP work opportunities created through construction projects2200 No performance report provided yet 

255. Property Management Trading EntityProgramme 4: Real Estate Management Services255IndicatorTarget Q2Output Q2Reason for Deviation Q2Number of identified vacant surplus State-owned properties let out 35 identified vacantsurplus state-ownedproperties let outNo performance report provided Number of work opportunities created through the letting out of State coastal properties and small harbours1 000 workopportunitiescreated throughthe letting out ofsmall harbour andState owned coastalproperties471The new letting out Framework has not been approved. The new letting out framework is the enabler through which new leases agreements will be signed and work opportunities be created.Percentage of lease agreements signed within scheduled timeframes 100%(2 of 3) 66%2 out of 3 leases were signed - unavailability of approved delegation for RMs to sign leases longer than 3 years.

256. Property Management Trading EntityProgramme 5: Real Estate Information & Registry Services256IndicatorTarget Q2Output Q2Reason for Deviation Q2Percentage of immovable assets updated on the IAR for completed infrastructure projects100% 100% - 24 of 24 completed projectsN/ANumber of land parcels vested (confirmation of ownership)225 180 land parcelsvesting process residing in DRDLRNumber of immovable assets physically verified to validate existence6 158 7360deviation not providedNumber of Provincial Immovable Asset Registers assessed for compliance33 provincial IAR assessed for compliance N/ANumber of National and Provincial Immovable Asset Registers incorporated into the single repository (National Database of State properties)20 national and provincial IAR incorporated into single registerBusiness case, funding model, Project Governance structure and procurement ToRs not finalised

257. Property Management Trading EntityProgramme 6: Facilities Management257IndicatorTarget Q2Output Q2Reason for Deviation Q2Number of facilities with maintenance contracts in place150530 and 80 term contractsDue to focus on preventative maintenance Regions are encouraged to enter into Term ContractsPercentage of unscheduled maintenance incidents resolved within agreed timeframes20%2.59%Worx4U - inadequacy of the system which reflects faulty controls from the design.Reduction in energy consumption (kilowatt hours) in identified buildings38 750 000 kWh546 341.2 kwhBilling delayed by 2 months due to Municipal billing and PoE verification.Number of kilowatt hours of renewable energy generated5 000 000 kWh(0) ZeroService provider in the process of being appointed. No metering device to record the actual energy generated from the solar.Reduction in water consumption (kilolitres) in identified buildings3 500 000 kl4 906 044.78 klIncreased performance due to focus on reducing utility expenditure in Government

258. The PresidencyProgramme 1: Administration258IndicatorTarget Q2Output Q2Reason for Deviation Q2Percentage of valid invoices paid within 30 days from date of receipt100 %99 %Human ErrorPercentage of desciplinary cases resolved within 90 days from date of awareness100 %67 %postponement letters attachedNumber of quarterly monitoring reports on the implementation of the Annual Programme of Action of the organised formations/structures to drive greater coherence and consistency in the implementation of economic policy and to support economic growth and job creation11NoneNumber of quarterly monitoring reports on the implementation of the Annual Programme of Action of the organised formations/structures to strengthen governance and service delivery.11None

259. The PresidencyProgramme 1: Administration259IndicatorTarget Q2Output Q2Reason for Deviation Q2Number of quarterly monitoring reports on the implementation of the Annual Programme of Action of the organised formations/structures to mobilise society, promote social cohesion and accelerate social transformation. 11NonePercentage vacancy rate in funded posts10 %14 %Filling of vacancies has been put in abeyance pending the finalisation of the NMOG processNumber of engagements facilitated between the Principals and the leaders of mechanisms and institutions of state and spheres of government to strengthen governance and accountability29NoneNumber of quarterly monitoring reports on the implementation of the Annual Programme of Action of the inter-governmental mechanisms aimed at fighting corruption in the public and private sector, enhance public and institutional ethics 11NoneNumber of targeted efforts to consciously communicate on issues of social cohesion and nation building24None

260. The PresidencyProgramme 2: Executive Support260IndicatorTarget Q2Output Q2Reason for Deviation Q2Number of quarterly progress reports on the implementation of the Annual Programme of Action of the inter-governmental mechanisms to unblock issues impeding on service delivery in priority areas. 11NoneNumber of quarterly progress reports on the content support provided to the structures chaired by the President and Deputy President such as Working Groups and Advisory Councils11NoneGovernment Policy agenda of the 6th Administration developed and implemented N/ANone

261. Public WorksProgramme 1: Administration261IndicatorTarget Q2Output Q2Reason for Deviation Q2Number of initiatives undertaken to accelerate the transformation agenda of the Department99N/APercentage of investigations initiated within 30 days in respect of validated allegations100%100% (8 of 8)N/ANumber of interventions recommended resulting from fraud risk management11N/APercentage of compliant invoices settled within 30 days100% compliant invoices settled within 30 days95%Delay in certification and submission of invoices for processing by line managersPercentage of bids awarded within 56 working days of closure of tender advertisement75% of bids awardedwithin 56 working days of closure of tender advertisement 6 out of 6 tenders awarded within 56 days of closure of advert worth 8 615 643,84100% 

262. Public WorksProgramme 1: Administration262IndicatorTarget Q2Output Q2Reason for Deviation Q2Percentage of quotations awarded within 30 working days from requisition date90% of quotationsawarded within 30working days fromrequisition date83% 121 Out of 158 Quotations were awarded within 30 days1. Some quotations are advertised for longer periods to maximise obtaining three quotations as per National Treasury requirements deviation.2. Negative response from the market where service providers do not submit quotations despite being invited.Percentage of compliant invoices settled within 30 days100% compliant invoices settled within 30 days95%Delay in certification and submission of invoices for processing by line managersPercentage of bids awarded within 56 working days of closure of tender advertisement75% of bids awardedwithin 56 working days of closure of tender advertisement 6 out of 6 tenders awarded within 56 days of closure of advert worth 8 615 643,84100% 

263. Public WorksProgramme 1: Administration263IndicatorTarget Q2Output Q2Reason for Deviation Q2Percentage of procurement spend for bids awarded to designated groups in line with Preferential Procurement Regulations 201780% of procurement spend for bids awarded to designatedgroups in line with Preferential Procurement Regulations 2017R3 292 269.45 out of R8 615 643.84 awards were made to designated groups38%Insufficient response from the market in terms of qualifying designated groups.Percentage of bids awarded to designated groups in line with Preferential Procurement Regulations 201780% of bids awardedto designated groups in line with Preferential Procurement Regulations 20174 out of 6 bids were awarded to designated groups 67%Insufficient response from the market in terms of qualifying designated groups.

264. Public WorksProgramme 1: Administration264IndicatorTarget Q2Output Q2Reason for Deviation Q2Percentage of funded prioritised vacancies filled as per approved recruitment plan100%75% (30 of 45)delays are due to the moratoriumNumber of property management modules implemented Not Q2 TargetNot Q2 TargetNumber of modules enhanced as per ERP implementation plan 10 Moduleunavailability of business representativePercentage of reported fraud and corruption misconduct cases subjected to disciplinary processes100%100% (5 of 5)N/APercentage of default judgements against the Department prevented100%100% (11 of 11)N/A

265. Public WorksProgramme 2: Intergovernmental Coordination265IndicatorTarget Q2Output Q2Reason for Deviation Q2Number of performance review reports for the Sector Programme of Action presented to Technical MinMec10Alignment of APPs between National and provincesNumber of agreements signed for joint service delivery with IGR partners50delays by external IGR ppartnersNational Department of Public Works Academy establishedPartnership MOU with NSG, Africa infrastructure development programme and Contruction developedPartnership MoUs with relevant stakeholders not developedAcademy on pause for further engagements

266. Public WorksProgramme 3: Expanded Public Works Programme266IndicatorTarget Q2Output Q2Reason for Deviation Q2Number of work opportunities reported in the EPWP-RS by public bodies 492 896510 644 workopportunities reportedin the EPWP-RS bypublic bodies.System training and data capturing work sessions were provided extensively as support measures to improve reporting on the EPWP Reporting System.Percentage EPWP participation among designated groups (women, youth and persons with disabilities) reported on the EPWP RS by public bodies55% Youth37%Target for youth was not met because programmes that have high youth participation were not reported.

267. Public WorksProgramme 3: Expanded Public Works Programme267IndicatorTarget Q2Output Q2Reason for Deviation Q2Percentage EPWP participation among designated groups (women, youth and persons with disabilities) reported on the EPWP RS by public bodies55% Women71%The target on Women was exceeded because programmes with high women participation were reported in Quarter 1.Percentage EPWP participation among designated groups (women, youth and persons with disabilities) reported on the EPWP RS by public bodies2% persons withdisabilities1%For Persons with Disabilities, target was not met because their participation is not yet mainstreamed across programmes. Number of contracted Non Profit Organisations (NPOs) to implement the Non-State Sector (NSS): NPO Programme supported.350 contracted 0 contracted NPOs supportedLate contracting of the implementing agent.Number of public bodies provided with technical support. 196 public bodiesprovided with technicalsupport.Delays in engagement with some municiplaities due to need for introduction of new technical support personnel. Number of frameworks on sector convergence approved Draft framework developed for consultation (EPWP Policy)N/A

268. Public WorksProgramme 4: Property and Construction Industry Policy and Research268IndicatorTarget Q2Output Q2Reason for Deviation Q2Developed Public Works Bill Policy options document developed for submission to Minister for consideration Public Works green paper not developed.Policy Options document can only be finalised after presentation to and approval of Comprehensive Policy Review Report by Minister. Process affected by transition from 5th to 6th Administration.Developed Construction Industry Development Board (CIBD) Amendment BillFinalise the amendments to CIDB ActAmendments to the CIDB Act developed. Developed Council for the Built Environment (CBE) Amendment BillDraft Built Environment Profession (BEPs) Policy submitted to Minister to approve for public consultationDraft BEP Policy Developed. Procurement process to appoint a service provider to consolidate inputs during public consultations for BEP Policy undertakenDeveloped Expropriation Act Draft Expropriation Bill developed Minister's approval to process the Expropriation Bill.  

269. Public WorksProgramme 5: Prestige Policy269IndicatorTarget Q2Output Q2Reason for Deviation Q2Number of planned State events supported with movable structures21The other planned events were achieved in quarter 1Percentage of movable assets requests provided within 60 days after approval by prestige client85%100% (2 out of 2) 

270. South African Police ServiceProgramme 1: Administration270IndicatorTarget Q2Output Q2Reason for Deviation Q2Percentage of minimum workforce maintained against the approved establishmentMaintain aminimumworkforce of93% in relationto the approvedestablishment191 43199,43%% (The establishment was 190 346, in relation to the approved establishment of 191 431).Monitoring processes were strengthened. Percentage of learners assessed and declared competent upon completion of their training in terms of the Training Provisioning Plan (TPP)97% of (20 863)98,60% (16 563 learners trained and 16 331 members learners competent)Courses were rescheduled to the 3rd and 4th quartter due to circumstances outside the control of Human Resource Development Division.Percentage of planned police facility projects completed, as per the SAPS Infrastructure Development ProgrammeN/A8,70% (14 from a total of 161). Projects are tentatively scheduled for completion, from the third quarter.

271. South African Police ServiceProgramme 1: Administration271IndicatorTarget Q2Output Q2Reason for Deviation Q2Percentage of identified Information Communication Technology (ICT) infrastructure deliverables achieved80%52%The Wide Area Network (WAN) and Local Area Network (LAN) upgrades are on hold, due to the unavailability of funds and the Xyplex upgrade is dependent on the allocation of Criminal Justice System (CJS) Revamp budget to the Technology Management Services (TMS) Division.Percentage of prioritised Information Systems (IS) solutions deliverables achieved85%55%The Automatic Fingerprint Identification System (AFIS) request submitted for proposal has not been published.

272. South African Police ServiceProgramme 1: Administration272IndicatorTarget Q2Output Q2Reason for Deviation Q2Percentage of disciplinary hearings finalised, within the prescribed timeframe90% of disciplinaryhearings finalisedwithin 60 calendardays93,72% (179 from a total of 191).Implementation of weekly monitoring tools.Percentage of finalised service terminations submitted to various pension funds, within the prescribed timeframe70% finalisedserviceterminationssubmitted tovarious pensionfunds within 60working days96,17% (2 237 from a total of 2 326).Daily monitoring of PERSAP 2.21.57 Report.Percentage of learners assessed and declared competent upon completion of their training in the following prioritised training areas: Visible Policing and Detective Service (Crime Prevention)97% of (1 570)99,86% (702 learners trained and 701 learners declared competent). Courses were reschedule to the 3rd and 4th quarter due to circumstances outside the control of Human Resource Development Division.Percentage of learners assessed and declared competent upon completion of their training in the following prioritised training areas: Visible Policing and Detective Service (Crimes committed against women and children)97% of (3 237)99,77% (3 007 learners trained and 3 000 learners declared competent). Non-attendance of the courses by some of the members.

273. South African Police ServiceProgramme 1: Administration273IndicatorTarget Q2Output Q2Reason for Deviation Q2Percentage of learners assessed and declared competent upon completion of their training in the following prioritised training areas: Visible Policing and Detective Service (Crime Investigations)97% of (3 033)98,99% (3 265 learners trained and 3 232 learners declared competent).Additional courses were presented, in addition to the TPP.Percentage of learners assessed and declared competent upon completion of their training in the following prioritised training area: specialised capabilities (Public Order Policing)97% of (716)99,54% (861 learners trained and 857 learners declared competent). Additional courses were presented, in addition to the TPP.Percentage of learners assessed and declared competent upon completion of their training in the following prioritised training area: specialised capabilities (Forensic Science)97% of (739)98,74% (476 learners trained and 470 learners declared competent). Courses were reschedule to the 3rd and 4th quarter due to circumstances outside the control of Human Resource Development Division.Percentage of learners assessed and declared competent upon completion of their training in the following prioritised training area: specialised capabilities (Crime Intelligence)97% of (33298,62% (290 learners trained and 286 learners declared competent).Courses were reschedule to the 3rd and 4th quarter due to circumstances outside the control of Human Resource Development Division.

274. South African Police ServiceProgramme 1: Administration274IndicatorTarget Q2Output Q2Reason for Deviation Q2Percentage of learners assessed and declared competent upon completion of their training in the following prioritised training area: specialised capabilities (Cybercrime)97% of (440Courses were reschedule to the 3rd and 4th quarter due to circumstances outside the control of Human Resource Development Division.N/APercentage of operational personnel declared competent in the modules: Legal Principles and the Use of Firearms: Handgun95% of (1 008)91,64% (274 from a total of 299 operational personnel declared competent). Non-attendance of the courses by some of the members. Lack of ammunition.

275. South African Police ServiceProgramme 1: Administration275IndicatorTarget Q2Output Q2Reason for Deviation Q2Percentage of Independent Police Investigative Directorate (IPID) recommendations initiated, within the prescribed timeframe100% initiatedwithin 30 calendardays of receipt100% (A total of 403 from a total of 403) recommendations were initiated.N/APercentage of IPID-related disciplinary hearings finalised, within the prescribed timeframe90% finalisedwithin 60 calendardays90,24% (37 from a total of 41). A total number of 8 cases were still pending within 60 calendar days.Implementation of weekly monitoring tools.Planned police facility projects completed, as per the SAPS Infrastructure Development Programme in the following prioritised area: Capital worksN/A9,03% (13 from a total of 144). Projects are tentatively scheduled for completion, from the third quarter.Planned police facility projects completed, as per the SAPS Infrastructure Development Programme in the following prioritised area: Planned maintenanceN/A5,88% (1 from a total of 17). Projects are tentatively scheduled for completion, from the third quarter.

276. South African Police ServiceProgramme 1: Administration276IndicatorTarget Q2Output Q2Reason for Deviation Q2Number of SAPS-owned firearms reported as stolen/lost151189Non-compliance to prescripts and the Standard Operating Procedure.Number of identified digital radio communication infrastructure sites modernised and implemented21 High sites7 from a total of 21 high sites modernised and implemented.Delayed due to administrative process in the procurement application.Number of identified National Network Communication Infrastructure sites modernised and implemented45 WAN sites40 LAN sites0 from a total of 45 WAN sites modernised and implemented.0 from a total of 40 LAN sites modernised and implemented.An insufficient budget was allocated to this project.Number of prioritised sites implemented with Closed-Circuit Television (CCTV)36 sites0 from a total of 36 sites implemented.No budget was allocated to this project.Number of Remotely Piloted Aircraft Systems (RPAS) issued to prioritised areas1 RPAS0 from a total of 1 RPAS issued to prioritised areas.No budget was allocated to this project.Number of prioritised sites implemented with case management capabilitiesN/A0 ICDMS sites implemented.The delay by State Information Technology Agency to appoint development resources (personnel) on the Investigation Case Docket Management System – Investigate Case project.

277. South African Police ServiceProgramme 1: Administration277IndicatorTarget Q2Output Q2Reason for Deviation Q2Number of prioritised sites implemented with modernised incident management capabilities00Planned to commence, in the third quarter.Number of prioritised sites implemented with person management capabilities75 PIVA sites88 from a total of 75 PIVA sites implemented.Implementation has been fast tracked, due to the urgency of PIVA.Percentage of audits completed, in terms of the approved Internal Audit Plan30% (50)26,51% (44 from a total of 166). Internal Audit was requested by management to address an irregular expenditure qualification, issued by the AGSA. As a result, resources were redirected.

278. South African Police ServiceProgramme 1: Administration278IndicatorTarget Q2Output Q2Reason for Deviation Q2Percentage of planned forensic investigations finalisedN/A0%A total number of 11 investigations are in progress.Percentage of intervention execution standards executedN/A33,33% (90 from a total of 270).N/APercentage of crime-related hits reacted to as a result of Movement Control System and Enhanced Movement Control System screening100%100% (1 158, including 600 wanted person hits and 558 stolen/robbed vehicle hits reacted to).N/APercentage of profiled vehicles/containers and cargo consignment searched for illicit drugs, firearms, stolen/robbed vehicles, consignment, smuggled persons and counterfeit goods/contraband100%100% (5 406, including 1 980 vehicles, 2 244 containers and 1 182 cargo profiled and searched).N/APercentage of crime-related hits reacted to as a result of Movement Control System and Enhanced Movement Control System screening on wanted persons/circulated stolen or robbed vehicles: Reaction to hits wanted persons100%100% (600 wanted person hits reacted to).N/A

279. South African Police ServiceProgramme 2: Visible Policing279IndicatorTarget Q2Output Q2Reason for Deviation Q2Percentage of crime-related hits reacted to as a result of Movement Control System and Enhanced Movement Control System screening on wanted persons/circulated stolen or robbed vehicles: Reaction to hits stolen/robbed vehicles100%100% (558 stolen/robbed vehicle hits reacted to).N/APercentage of profiled vehicles/containers and cargo consignment searched for illicit drugs, firearms, stolen/robbed vehicles, consignment, smuggled persons, and counterfeit goods/contraband: Vehicles100%100% (1 980 vehicles profiled and searched).N/APercentage of profiled vehicles/containers and cargo consignment searched for illicit drugs, firearms, stolen/robbed vehicles, consignment, smuggled persons, and counterfeit goods/contraband: Containers100%100% (2 246 containers profiled and searched).N/APercentage of identified police stations that have functional Community Policing Forums (CPFs), according to set guidelines99% of 1 149police stations99,48% (1 148 from a total of 1 154).Boetsap, Kubusiedrift and Mokgopong Police Stations are exempted from having a CPF, as they have no community in the policing precinctNumber of reported contact crimes272 681Increased by 1,2%, from 291 535 reported contact crimes during semester 1, in 2018/2019, to 295 151 during the semester 1, in 2019/2020.Crimes, such as rape, attempted rape and sexual assault take place behind closed doors.

280. South African Police ServiceProgramme 2: Visible Policing280IndicatorTarget Q2Output Q2Reason for Deviation Q2Number of reported contact-related crimes55 607Reduced by 2,7%, from 56 683 reported contact- related crimes during semester 1, in 2018/2019, to 55 161 during the semester 1, in 2019/2020.Various operations are ongoing,The Eyes and Ears Project was piloted, in the Gauteng Province and yielded positive results.Number of reported property-related crimes243 938Reduced by 4,8%, from 249 223 reported property- related crimes during semester 1, in 2018/2019, to 237 317 during semester 1, in 2019/2020.Various operations are ongoing,The Eyes and Ears Project was piloted, in the Gauteng Province and yielded positive results.Number of reported other serious crimes207 199Reduced by 3,4%, from 222 464 reported other serious crimes during semester 1, in 2018/2019, to 214 966 during semester 1, in 2019/2020.Various operations are ongoing,The Eyes and Ears Project was piloted, in the Gauteng Province and yielded positive results.Number of reported serious crimes at the identified 30 high crime weight stations87 140Reduced by 3,1%, from 104 369 reported other serious crimes during semester 1, in 2018/2019, to 101 115 during semester 1, in 2019/2020.Various operations are ongoing,The Eyes and Ears Project was piloted, in the Gauteng Province and yielded positive results.

281. South African Police ServiceProgramme 2: Visible Policing281IndicatorTarget Q1Output Q1Reason for Deviation Q1Target Q2Output Q2Reason for Deviation Q2Number of reported contact crimes at the identified 30 high crime weight stations17 284Increased by 2,4%, from 21 735 reported serious crimes during the first quarter, in 2018/2019 to 22 260 during the first quarter, in 2019/2020.Will be provided with the validated report, as feedback from some provincial offices are still outstanding.34 569Increased by 0,8%, from 45 309 reported contact crimes during semester 1, in 2018/2019, to 45 686 during the semester 1, in 2019/2020.Crimes, such as rape, attempted rape and sexual assault take place behind closed doors.Number of stolen/lost and illegal firearms recovered1 351 firearms3 621Implementation of the Property and Exhibit Management Turnaround Plan.1 351 firearms3 047Intelligence driven operations, such as Operation O Kae Molao.

282. South African Police ServiceProgramme 2: Visible Policing282IndicatorTarget Q2Output Q2Reason for Deviation Q2Number of identifiable stolen/lost SAPS firearms recovered39 firearms125Intelligence driven operations, such as Operation O Kae Molao.Number of stolen/robbed vehicles recovered9 137 vehicles8 667 (7 353 identified vehicles, 1 262 unidentified vehicles and 52 vehicles during cross-border operations). First phase cancellation not including all the vehicles recovered. Number of escapees from police custody384311The National Plan and Provincial Plans to prevent escape incidents and other offences by prisoners are being implemented. Percentage of applications for new firearm licenses finalised within 90 working days90% of newapplicationsfinalised within 90working days84,67% (20 035 from a total of 23 662).Slowness of the system during peak hours.

283. South African Police ServiceProgramme 2: Visible Policing283IndicatorTarget Q2Output Q2Reason for Deviation Q2Average national police reaction time to Alpha Complaints17:37 minutes17:19 minutes Regular monitoring of the system on a daily basis on all levels.Average national police reaction time to Bravo Complaints21:28 minutes21:24 minutes Regular monitoring of the system on a daily basis on all levels.Average national police reaction time to Charlie Complaints19:13 minutes19:10 minutes Regular monitoring of the system on a daily basis on all levels.Percentage of police stations rendering a victim-friendly service to victims of rape, sexual offences, domestic violence and abuse100% of 1 149police stationscompliant with2 of the 3 setcriteria99,74% (1 151 from a total of 1 154).Qhasa, in the Eastern Cape Province, Bohlokong, in the Free State Province and Moletlane, in the Limpopo Province were not compliant with the set criteria.Number of rural and rural/urban mixed police stations implementing the set criteria of the four pillars of the Rural Safety Strategy865 from a totalof 883 identifiedpolice stations878 from a total of 883.Combined assurance assessment at national, provincial and cluster/district level was implemented and assessed.

284. South African Police ServiceProgramme 2: Visible Policing284IndicatorTarget Q2Output Q2Reason for Deviation Q2Number of community outreach campaigns conducted2310 (4 National and 6 Provincial)Will be provided with validated performance. Number of schools identified to implement the School Safety Programme390Will be provided with validated performance. Will be provided with validated performance. Percentage of crowd management incidents policed or stabilised100%100% (3 274, including 2 238 crowd peaceful incidents and 1 036 crowd unrest incidents stabilised).N/APercentage of medium to high-risk incidents responded to, in relation to requests received100%100% (248, including 203 incidents responded to by NIU and 45 incidents responded to by STF).N/APercentage of safe delivery of valuable and/or dangerous government cargo, in relation to the number of cargo protection provided100%100% (30 safe delivery and protection provided).N/A

285. South African Police ServiceProgramme 2: Visible Policing285IndicatorTarget Q2Output Q2Reason for Deviation Q2Percentage of medium to high-risk incidents responded to, in relation to requests received by the following units: National Intervention Unit100%100% (203 incidents responded to).N/APercentage of medium to high-risk incidents responded to, in relation to requests received by the following units: Special Task Force100%100% (45 incidents responded to).N/APercentage of peaceful crowd management incidents policed100%100% (2 238 peaceful incidents policed).N/APercentage of unrest crowd management incidents stabilised100%100% (1 036 unrest incidents stabilised).N/A

286. South African Police ServiceProgramme 3: Detective Services286IndicatorTarget Q2Output Q2Reason for Deviation Q2Detection rate for serious crimes37.25%36,59% (768 156 from a total of 2 099 382).Crime scenes are contaminated by the community before the first responder arrives at the scene, resulting in contaminated forensic evidence.Trial-ready case docket rate for serious crimes84.34%92,10% (355 809 from a total of 386 335).Docket inspections are conducted to ensure that dockets are fully investigated and can be used by the NPA for the purpose of proceeding with a trial of an offender(s), on charge(s) linked to the case docket. Detection rate for contact crimes55.22 %50,28% (400 612 from a total 796 809).Murder, attempted murder, sexual assault, assault common, attempted common robbery and contact sexual offences contributed to the underperformance.Trial-ready case docket rate for contact crime83.79 %91,72% (211 452 from a total of 230 538).Docket inspections are conducted, to ensure that dockets are fully investigated and can be used by the NPA

287. South African Police ServiceProgramme 3: Detective Services287IndicatorTarget Q2Output Q2Reason for Deviation Q2Detection rate for crimes committed against women 18 years and above (murder, attempted murder, all sexual offences, common assault and assault GBH)75.10%73,63% (147 140 from a total of 199 847).Rape, attempted rape, sexual assault contributed to the underperformance.Trial-ready case docket rate for crimes committed against women 18 years and above (murder, attempted murder, all sexual offences, common assault and assault GBH)70.05%68,20% (40 463 from a total of 59 334).Children as victim statements are not always up to the required standard,Trial-ready case docket rate for crimes committed against children under 18 years (murder, attempted murder, all sexual offences, common assault and assault GBH)78.65%89,62% (32 621 from a total of 36 400).Docket inspections are conducted to ensure that dockets are fully investigated and can be used by the NPADetection rate for contact-related crimes47.70%50,27% (66 420 from a total of 132 138).Dockets where the suspects are known, identified and forensic leads such as fingerprints are available, are effectively investigated before the court process.

288. South African Police ServiceProgramme 3: Detective Services288IndicatorTarget Q2Output Q2Reason for Deviation Q2Trial-ready case docket rate for contact-related crimes87.25%94,12% (22 040 from a total of 23 417).Docket inspections are conducted to ensure that dockets are fully investigated and can be used by the NPADetection rate for property-related crimes14.75%15,71% (94 975 from a total of 604 542).VDockets where the suspects are known, identified and forensic leads such as fingerprints are available, are effectively investigated before the court process.Trial-ready case docket rate for property-related crimes84.85%92,30% (42 738 from a total of 46 305).Docket inspections are conducted to ensure that dockets are fully investigated and can be used by the NPADetection rate for other serious crimes36.80%36,43% (206 149 from a total of 565 893).Fraud and attempted theft contributed to the underperformance.

289. South African Police ServiceProgramme 3: Detective Services289IndicatorTarget Q2Output Q2Reason for Deviation Q2Detection rate for criminal and violent conduct during public protests84.75%92,45% (79 579 from a total of 86 075).Docket inspections are conducted, to ensure that dockets are fully investigated and can be used by the NPATrial-ready case docket rate for other serious crimes44.70%45,72% (1 345 from a total of 2 942).Focused investigation supported by the establishment of teams to specifically dealing with public protest action related cases.Trial-ready case docket rate for criminal and violent conduct during public protests86%95,29% (1 397 from a total of 1 466).Docket inspections are conducted, to ensure that dockets are fully investigated and can be used by the NPATrial-ready case docket rate for serious crime at the identified 30 high crime weight stations86.92%94,55% (34 961 from a total of 43 865).Docket inspections are conducted, to ensure that dockets are fully investigated and can be used by the NPA

290. South African Police ServiceProgramme 3: Detective Services290IndicatorTarget Q2Output Q2Reason for Deviation Q2Trial-ready case docket rate for serious crime at the identified 30 high crime weight stations86.92%94,55% (34 961 from a total of 43 865).Docket inspections are conducted to ensure that dockets are fully investigated and can be used by the NPADetection rate for contact crimes at the identified 30 high crime weight stations55.96%39,32% (42 063 from a total of 106 970).Murder, attempted murder, sexual assault, assault common, attempted common robbery, contact sexual offences contributed to the underperformance.Detection rate for contact crimes at the identified 30 high crime weight stations55.96%39,32% (42 063 from a total of 106 970).Murder, attempted murder, sexual assault, assault common, attempted common robbery, contact sexual offences contributed to the underperformance.Trial-ready case docket rate for contact crime at the identified 30 high crime weight stations87.92%94,15% (20 784 from a total of 24 094).Docket inspections are conducted to ensure that dockets are fully investigated and can be used by the NPA

291. South African Police ServiceProgramme 3: Detective Services291IndicatorTarget Q2Output Q2Reason for Deviation Q2Percentage reduction in outstanding wanted persons already circulated at the identified 30 high crime weight stations5%1,48% (658 from a total of 44 316).Rerouting of resourcesDetection rate for serious crimes at the identified 30 high crime weight stations37.65%32,33% (78 311 from a total of 242 252).Murder, attempted murder, assault common, fraud, attempted robbery (robbery aggravated with a firearm), attempted common robbery, attempted rape and attempted theft contributed to the underperformance.Percentage of original previous conviction reports generated95% originalprevious convictionreports generatedwithin 15 calendardays98,75% (263 729 from a total of 267 074).Implementation of effective workflow processes contributed to the achievement.Percentage of results of trial updated in respect of the following: Guilty Verdict95% of results of trial(guilty) updatedwithin 20 calendardays82,57% (62 761 from a total of 76 013).A project has been launched, with regards to the purification of results of trial in case dockets by detectives.

292. South African Police ServiceProgramme 3: Detective Services292IndicatorTarget Q2Output Q2Reason for Deviation Q2Percentage of results of trial updated in respect of the following: Not Guilty Verdict95% of results oftrial (not guilty/withdrawn)updated within 20calendar days83,19% (265 278 from a total of 318 891).A project has been launched, with regards to the purification of results of trial in case dockets by detectives.Percentage registered case exhibits (entries) exceeding the prescribed timeframeBacklog notexceeding 10% ofregistered caseexhibits (entries)received20,75% (36 293 from a total of 174 886).External factors had a negative impact on the finalisation of routine cases (water interruptions and power outrages).Percentage of routine case exhibits (entries) finalised75% of routine caseexhibits (entries)processed within 35calendar days70,18% (37 133 from a total of 52 908).External factors had a negative impact on the finalisation of routine cases (water interruptions and power outrages).Percentage of non-routine case exhibits (entries) finalised70% of non-routinecase exhibits(entries) processedwithin 113 calendardays70,95% (1 143 from a total of 1 611).70,95% (1 143 from a total of 1 611).

293. South African Police ServiceProgramme 3: Detective Services293IndicatorTarget Q2Output Q2Reason for Deviation Q2Percentage of IBIS Intelligence case exhibits (entries) finalised95% of IBIS caseexhibits (entries)finalised within 35calendar days99,81% (513 from a total of 514).Implementation of effective workflow processes contributed to the achievement.Percentage of Biology DNA Intelligence case exhibits (entries) finalised80% of DNAintelligence caseexhibits (entries)processed within 90calendar days74,86% (5 630 from a total of 7 520).CI lanes were negatively impacted, due to down time. RI lanes were down.There were no quantification kits (consumables used for analysis).

294. South African Police ServiceProgramme 3: Detective Services294IndicatorTarget Q2Output Q2Reason for Deviation Q2Percentage of trial-ready case dockets for fraud and corruption within the JCPS Cluster77%87,50% (378 from a total of 432).Adhering to prosecutors remarks to finalise the investigations.Conviction rate for fraud and corruption within the JCPS Cluster70%100% (26 from a total of 26).Will be provided with validated performance. Conviction rate for fraud and corruption within the Public Sector70%100% (414 from a total of 414).Will be provided with validated performance. Conviction rate for fraud and corruption within the Private Sector70%100% (12 from a total of 12).Will be provided with validated performance. Conviction rate for serious commercial crime-related charges97%98,11% (20 792 from a total of 21 192).The enhancing of the multidisciplinary investigative approach.Enhancing of the Joint Strategy between DPCI and NPA.

295. South African Police ServiceProgramme 3: Detective Services295IndicatorTarget Q2Output Q2Reason for Deviation Q2Percentage of registered serious organised crime project investigations successfully closedN/A0%No projects were succesfully closed.Percentage of specialised cybercrime investigative support case files successfully investigated55%47,54% (29 from a total of 61).Lack of capacity. Lengthy duration of investigations. Percentage of trial-ready case dockets for fraud and corruption within the Public Sector70%80,55% (58 from a total of 72).Will be provided with validated performance. Percentage of trial-ready case dockets for fraud and corruption within the Private Sector66%80,45% (107 from a total of 133).Will be provided with validated performance. Percentage of trial-ready case dockets for serious commercial crime-related charges65%70,83% (1 943 from a total of 2 743).In - Service training provided to investigators. Investigators were sensitised to their roles in achieving targets of the performance indicators. Percentage of clandestine laboratories dismantled with arrests90%85,71% (6 laboratories dismantled with 17 arrests)Will be provided with validated performance.

296. South African Police ServiceProgramme 4: Crime Intelligence296IndicatorTarget Q2Output Q2Reason for Deviation Q2Percentage of network operations successfully terminated25% (142)30,18% (172 from a total of 570).Interventions were implemented by Head Office, namely; in loco visits and guidance and monitoring by the Acting Section Head: Cluster Coordination and Overt OperationsPercentage of security risk and vetting assessments conducted25% (1 238)35,26% (1 747 from a total of 4 954).ICT and physical security assessments are usually carried out concurrently, per building and unit and it might happen that more laptops and computers are assessed at a specific building, in order to finalise the whole building at oncePercentage of security clearances finalised, in relation to the total planned annually25% (288)25,56% (295 from a total of 1 154).Stricter control and performance measurements implemented by the Section Head: Vetting Investigation. Percentage of ICT security assessments finalised, in relation to the total planned annually25% (790)38,20% (1 207 from a total of 3 160).ICT and physical security assessments are usually carried out concurrently, per building and unit and it might happen that more laptops and computers are assessed at a specific building, in order to finalise the whole building at once. Percentage of mandatory physical security assessments finalised, in relation to the total planned annually25% (160)38,28% (245 from a total of 640).ICT and physical security assessments are usually carried out concurrently, per building and unit and it might happen that more laptops and computers are assessed at a specific building, in order to finalise the whole building at once.

297. South African Police ServiceProgramme 4: Crime Intelligence297IndicatorTarget Q2Output Q2Reason for Deviation Q2Percentage of security awareness programmes conducted, in relation to the total planned annually25% (76)36,60% (112 from a total of 306).The Divisional Commissioner placed high emphasis on the conducting of security awareness programmes, especially to Crime Intelligence members, due to the risk of Crime Intelligence members leaking classified information to the media.Percentage of intelligence reports that were operationalised70%85,92% (89 751 from a total of 104 462).The implementation of feedback forms by Crime Intelligence is starting to show success pertaining to the operationalisation of proactive and reactive intelligence reports.Percentage of cross-border operations and arrests of identified transnational crime suspects facilitated, in relation to requests received from INTERPOL member countries100%66,67% (4 from a total of 6)Two of the cross-border operations will, due to operational planning, only conclude in the third quarter. Percentage of proactive intelligence reports that were operationalised at cluster level70%84,67% (10 668 from a total of 12 599).The implementation of feedback forms by Crime Intelligence is starting to show success pertaining to the operationalisation of proactive intelligence reports.Percentage of proactive intelligence reports that were operationalised at provincial level80%79,25% (3 200 from a total of 4 038).Although the feedback system, implemented by Crime Intelligence, is yielding positive results, there are still clients on provincial level, who are reluctant to submit completed feedback forms, timeously.

298. South African Police ServiceProgramme 4: Crime Intelligence298IndicatorTarget Q2Output Q2Reason for Deviation Q2Percentage of proactive intelligence reports that were operationalised at national level90%91,72% (1 762 from a total of 1 921).The implementation of feedback forms by Crime Intelligence is starting to show success pertaining to the operationalisation of proactive intelligence reports.Percentage of reactive intelligence reports that were operationalised at cluster level70%92,04% (47 332 from a total of 51 423).The implementation of feedback forms by Crime Intelligence is starting to show success pertaining to the operationalisation of reactive intelligence reports.Percentage of reactive intelligence reports that were operationalised at provincial level80%76,53% (23 910 from a total of 31 244).Although the feedback system, implemented by Crime Intelligence, is yielding positive results, there are still clients on provincial level, who are reluctant to submit completed feedback forms, timeously. Percentage of reactive intelligence reports that were operationalised at national leve90%88,94% (2 879 from a total of 3 237).Quarterly target not achieved. Although the feedback system, implemented by Crime Intelligence, is yielding positive results, however, there are still clients on provincial level who are reluctant to submit completed feedback forms, timeously.

299. South African Police ServiceProgramme 4: Crime Intelligence299IndicatorTarget Q2Output Q2Reason for Deviation Q2Percentage of cross-border operations facilitated, on request from INTERPOL member countries100%50,00% (2 from a total of 4).Two of the cross-border operations will, due to operational planning, only conclude in the third quarter. Percentage of arrests of identified transnational crime suspects facilitated, in relation to requests received from INTERPOL member countries100%100% (2 from a total of 2).N/A

300. South African Police ServiceProgramme 5: Protection and Security Services300IndicatorTarget Q2Output Q2Reason for Deviation Q2Percentage of strategic installations audited by PSS19.84% (25)19,05% (24 from a total of 126).Will be provided with validated performance. Percentage of National Key Points evaluated24.88% (54 froma total of 217)24,88% (54 from a total of 217).N/APercentage of National Key Points evaluated by PSS24.75% (51 from atotal of 206)24,76% (51 from a total of 206).N/APercentage of National Key Points evaluated by PPS27.27% (3 from atotal of 11)27,27% (3 from a total of 11).N/A

301. South African Police ServiceProgramme 5: Protection and Security Services301IndicatorTarget Q2Output Q2Reason for Deviation Q2Percentage of protection provided at identified government installations and identified VIP residences without security breaches: PSS100% (0)100% protection provided without security breaches.N/APercentage of protection provided at identified government installations and identified VIP residences without security breaches: PPS100% (0)100% protection provided without security breaches.N/APercentage of protection provided to VIPs without security breaches: PSS100% (0)100% protection provided without security breaches.N/APercentage of protection provided to VIPs without security breaches: PPS100% (0)100% protection provided without security breaches.N/A

302. Sports and Recreation South AfricaProgramme 1: Administration302IndicatorTarget Q2Output Q2Reason for Deviation Q2Number of employees trained2026Unaccredited training in response to identified training needs, had to be offeredNumber of Information and Communication Technology (ICT) Strategy Implementation Plan Status Reports adopted at MANCO111ICT status report Percentage of invoices paid within 30 days100 %100 %None

303. Sports and Recreation South AfricaProgramme 2: Active Nation303IndicatorTarget Q2Output Q2Reason for Deviation Q2Number of recreation promotional campaigns and events implemented per year11NoneNumber of people actively participating in recreation promotion campaigns and events per year10001760There were more participants at the Jiyana (Tembisa) Unite CampaignNumber of sport promotion campaigns and events implemented per year10Close-out report still to be submitted after the debrief meeting with stakeholdersNumber of people actively participating in sport promotion campaigns and events per year 13641002Registers from the Kwanambi Outreach are still outstanding. Will be included in q3.Number of people actively participating in organised sport and active recreation events100000102708There was increased interest in mass-based events’ participation. This happens mainly through partner events that add to the planned numbers.Number of learners participating in school sport tournaments at a district level2000023925There was more interest in schools participating.Number of schools, hubs and clubs provided with equipment and/or attire as per the established norms and standards per year500596some provinces were able to support more beneficiaries due to affordability

304. Sports and Recreation South AfricaProgramme 2: Active Nation304IndicatorTarget Q2Output Q2Reason for Deviation Q2Number of athletes supported by the sports academies per year10001301Academies now-and-then support sport federations on an adhoc basisNumber of sport academies supported1017Provinces were able to support more academiesNumber of National School Sport Championships supported per year11NoneNumber of learners in National School Sport Championships per year15003190On analysing registered participants, it was realised that there were less able-bodied athletes. In order to strike a balance, a concession was made to add able-bodied athletes.

305. Sports and Recreation South AfricaProgramme 3: Winning Nation305IndicatorTarget Q2Output Q2Reason for Deviation Q2Number of major international events receiving intra-Governmental support per year11none Number of recognition and honouring events11The Performance of the Netball Team at the Netball World warranted recognition by the Minister. Number of SASCOC MOU progress reports evaluated10Report not submitted by SASCOC. The departmental evaluation is dependent on SASCOC submitting the report.Number of athletes supported through the Ministerial Sports Bursary Programme10289 is a delayed report from quarter 1 and 28 for quarter 2)Number of athletes supported through the scientific support programme per year2020Annual target achievedNumber of drug-free sport support agencies supported11none

306. Sports and Recreation South AfricaProgramme 4: Sport Support306IndicatorTarget Q2Output Q2Reason for Deviation Q2Number of bilateral engagements implemented11noneNumber of status reports detailing multilateral engagements supported14The timing of this kind of engagements is not always known at the time of planning.Number of good governance monitoring reports generated11NoneNumber of sport and recreation bodies receiving financial and non-financial support in an effort to assist them in meeting their transformation targets per year50The difference of six sport and recreation bodies could not be paid due to low cash flow available for Q2Number of Sport Trust MOU progress reports evaluated11None

307. Sports and Recreation South AfricaProgramme 5: Sport Infrastructure Support307IndicatorTarget Q2Output Q2Reason for Deviation Q2Number of municipalities provided with technical and management support4056noneNumber of community gyms and children’s play parks constructed00not yet due for reporting

308. Statistics South AfricaProgramme 1: Administration308IndicatorTarget Q2Output Q2Reason for Deviation Q2Corporate Governance quarterly reports compiled11Monthly integrated management information reports compiled33 Strategic planning and reporting documents compiled: Organisational quarterly reports (prelim) submitted 30 days after the end of the quarter11

309. Statistics South AfricaProgramme 2: Economic Statistics309IndicatorTarget Q2Output Q2Reason for Deviation Q2Number of releases on financial statistics of municipalities published with a quarterly lag: Quarterly releases on financial statistics of municipalities published as scheduled111 Number of quarterly GDP releases published as scheduled111Number of monthly CPI releases published on the second last Wednesday of every month333Number of monthly PPI releases published on the last Thursday of every month999Number of quarterly releases on financial statistics of private sector enterprises published as scheduled111 Number of releases on mining: production and sales, published 6 weeks after the reference month333Number of releases on manufacturing: production and sales published, 6 weeks after the reference month333Number of releases on manufacturing: utilisation of production capacity by large enterprises published, 10 weeks after the reference month111

310. Statistics South AfricaProgramme 2: Economic Statistics310IndicatorTarget Q2Output Q2Reason for Deviation Q2Number of releases on generation and consumption of electricity published, 5 weeks after the reference month333Number of releases on selected building statistics published, 7 weeks after the reference month333Number of releases on retail trade sales published, 7 weeks after the reference month333Number of releases on wholesale trade sales published, 7 weeks after the reference month333Number of releases on land transport published, 8 weeks after the reference month333 Number of releases on liquidations and insolvencies published, 8 weeks after the reference month333Number of releases on food and beverages published, 8 weeks after the reference month333 Number of releases on tourist accommodation published, 8 weeks after the reference month333

311. Statistics South AfricaProgramme 3: Population and Social Statistics311IndicatorTarget Q2Output Q2Reason for Deviation Q2Number of releases on international tourism published, 3 months after the reference period333Number of quarterly releases on employment and earnings and average monthly earnings published as scheduled111Number of quarterly releases on labour market information published as scheduled111Programme 4: Methodology, Standards and ResearchPerformance for Programme 4 is reported annually.

312. Statistics South AfricaProgramme 5: Statistical Support and Informatics312IndicatorTarget Q2Output Q2Reason for Deviation Q2Sampling frames for household surveys prepared as scheduled333100% ICT services availability achieved (during release of core business outputs)100 %100 %100 %

313. Statistics South AfricaProgramme 6: Statistical Collection and Outreach313IndicatorTarget Q2Output Q2Reason for Deviation Q2Dashboard of media perception compiled11190% Response rate for household surveys achieved90 %95.8 %90 % 90% Response rate for household surveys achieved90 %96.7 %90 %80% Response rate for household surveys achieved80 %83.2 %80 % 90% Response rate for household surveys achieved90 %92 %90 %95% Response rate for household surveys achieved95 %98.9 %95 %

314. Statistics South AfricaProgramme 6: Statistical Collection and Outreach314IndicatorTarget Q2Output Q2Reason for Deviation Q290% Response rate for household surveys achieved QLFS90 %94.8 %90 % 90% Response rate for household surveys achieved QLFS90 %90.6 %90 % Statistical capacity building sessions conducted11090% Response rate for household surveys achieved QLFS90 %91.6 %90 %Statistical capacity building sessions conducted110

315. Statistics South AfricaProgramme 6: Statistical Collection and Outreach315IndicatorTarget Q2Output Q2Reason for Deviation Q295% simple queries handled within 15 minutes95 %99.02 %95 %90% normal queries handled within 24 hours90 %99.15 %90 %90% complex queries handled within 5 days90 %91.39 %90 %100% user training sessions conducted by March 2020100 %0 %100 %87% Response rate for household surveys achieved QLFS87 %88.05 %87 %Statistical capacity building sessions conducted 111IndicatorTarget Q2Output Q2Reason for Deviation Q2Number of training sessions on household surveys conducted by March 2020120Programme 7: Survey Operations