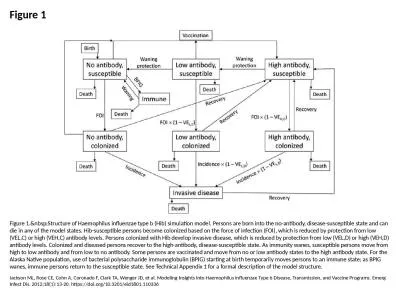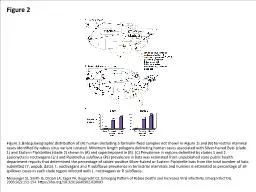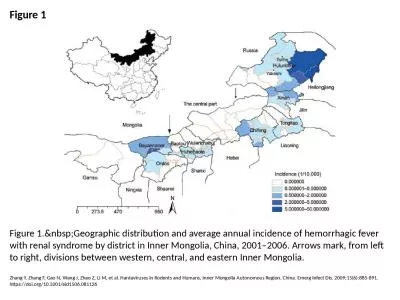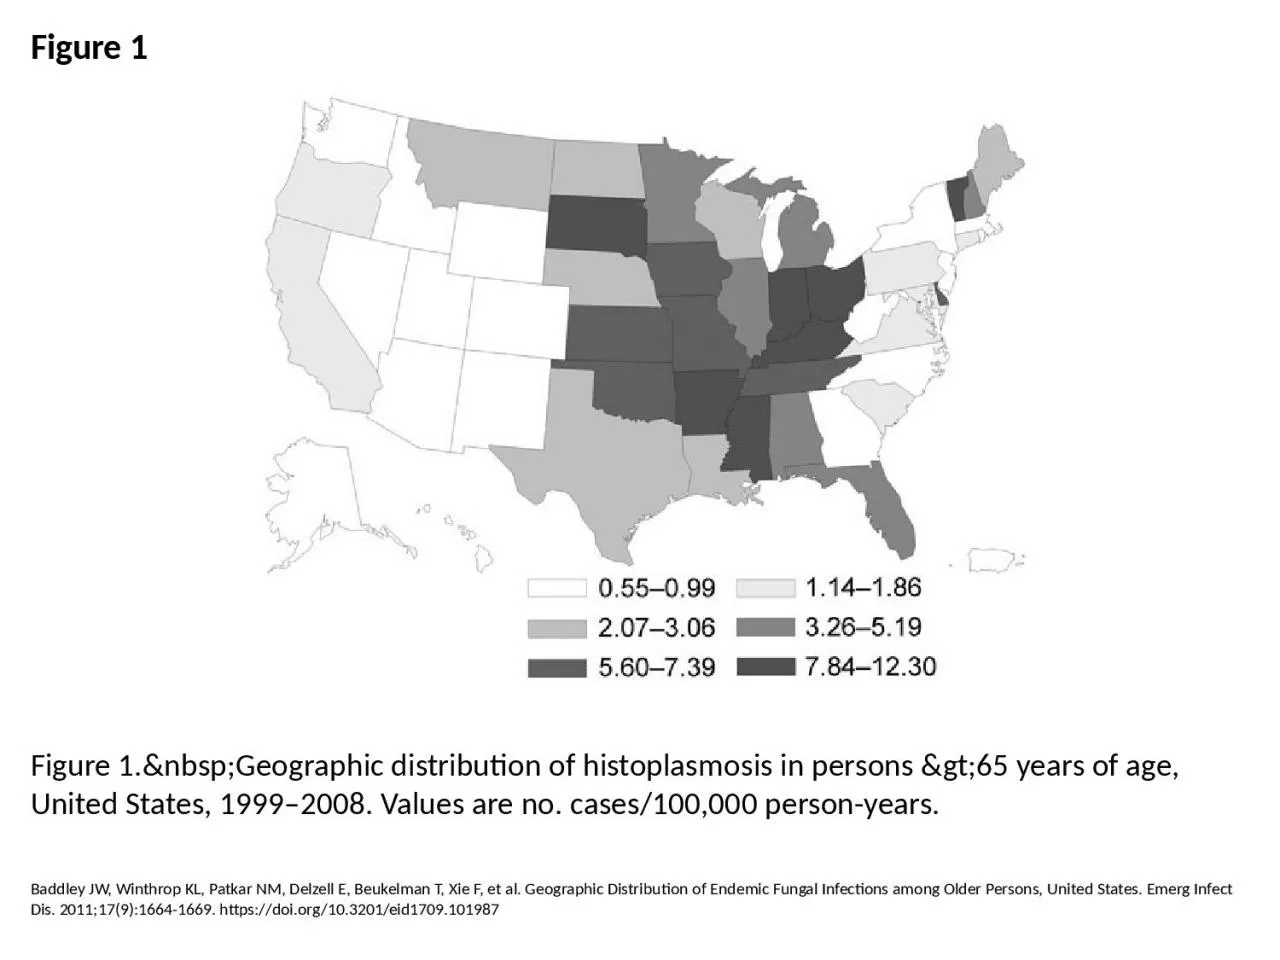
PPT-Figure 1 Figure 1. Geographic distribution of histoplasmosis in persons >65
Author : davies | Published Date : 2024-03-13
Baddley JW Winthrop KL Patkar NM Delzell E Beukelman T Xie F et al Geographic Distribution of Endemic Fungal Infections among Older Persons United States Emerg Infect
Presentation Embed Code
Download Presentation
Download Presentation The PPT/PDF document "Figure 1 Figure 1. Geographic d..." is the property of its rightful owner. Permission is granted to download and print the materials on this website for personal, non-commercial use only, and to display it on your personal computer provided you do not modify the materials and that you retain all copyright notices contained in the materials. By downloading content from our website, you accept the terms of this agreement.
Figure 1 Figure 1. Geographic distribution of histoplasmosis in persons >65: Transcript
Download Rules Of Document
"Figure 1 Figure 1. Geographic distribution of histoplasmosis in persons >65"The content belongs to its owner. You may download and print it for personal use, without modification, and keep all copyright notices. By downloading, you agree to these terms.
Related Documents