PDF-Explanation of the Analysis Format
Author : debby-jeon | Published Date : 2016-12-18
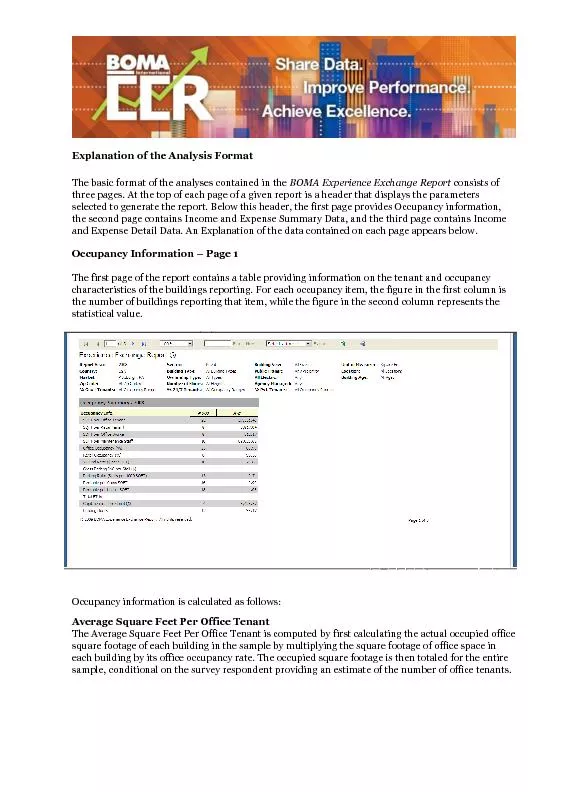
The basic format of the analyses contained in the BOMA Experience Exchange Report consists of three pages At the top of each page of a given report is a header that
Presentation Embed Code
Download Presentation
Download Presentation The PPT/PDF document "Explanation of the Analysis Format" is the property of its rightful owner. Permission is granted to download and print the materials on this website for personal, non-commercial use only, and to display it on your personal computer provided you do not modify the materials and that you retain all copyright notices contained in the materials. By downloading content from our website, you accept the terms of this agreement.
Explanation of the Analysis Format: Transcript
Download Rules Of Document
"Explanation of the Analysis Format"The content belongs to its owner. You may download and print it for personal use, without modification, and keep all copyright notices. By downloading, you agree to these terms.
Related Documents