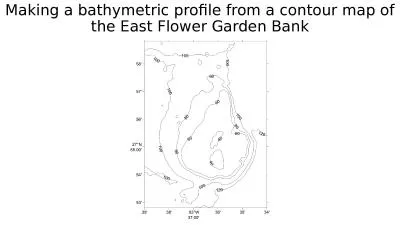
PPT-This is a topographic contour base map we will use to explo

Author : debby-jeon | Published Date : 2016-03-08

a ridge a valley g oing uphill closer contours steeper slope contours farther apart shallower slope Imagine that the red line represents a geologic contact of

Presentation Embed Code

Download Presentation

Download Presentation The PPT/PDF document "This is a topographic contour base map w..." is the property of its rightful owner. Permission is granted to download and print the materials on this website for personal, non-commercial use only, and to display it on your personal computer provided you do not modify the materials and that you retain all copyright notices contained in the materials. By downloading content from our website, you accept the terms of this agreement.

This is a topographic contour base map we will use to explo: Transcript


a ridge a valley g oing uphill closer contours steeper slope contours farther apart shallower slope Imagine that the red line represents a geologic contact of some sort Given that it doesnt parallel contours we know it isnt horizontal and given that it doesnt cut straight across contours we know it isnt vertical Can we tell something about its orientation . and . Compasses. Navigation Tools. Maps. Road maps. GPS (Global positioning system). Altimeter (altitude). Sextant (astronomy) . Watch. Topographic Maps. Compass. Topographic Maps. What's the difference between a topographic map and a regular map?. Topographic Maps. Contouring. Topographic contours indicating surface relief. Image taken from US Army training manual.. Solid yellow lines represent surface isobars, line of equal air pressure. Green dashed lines are geopotential heights, the altitude at which 500 millibars of air pressure are attained. These types of contour maps are used by meteorologists. The weather system shown is the Storm of the Century, a powerful winter storm called a nor’easter.. Match your cards.. Take notes in your science notebook.. Label your map.. Map Notes. topography. The study…. The study of the shapes and features of the Earth’s surface.. Topography. Shows the three dimensional shape and elevations of an area of land in two dimensions. exit ticket. Topographic Map Exit Ticket. 1) What . is the contour interval of this contour map? . _____________. 2) Estimate the elevation at point C. . _____________. 10 m. 21 m OR 22 m. Topographic Map Exit Ticket. Topography. Shows the three dimensional shape and elevations of an area of land in two dimensions. Topographic Map. Height above sea level. Elevation. Line that connects places on a topographic map that are all at the same elevation (eventually a closed loop). Contour lines never cross or touch!. Mapping Mechanics: . An introduction to topography . by the use of contour lines . Upon completion of this lesson, students will be able to:. define topography. define the USGS and different techniques used to study topography. Maps. Topographic Map. :. A . contour map. -. Complicated Topographic Map. Simple Topographic Map. I am standing where the land meets the water, what is this called?. *All elevations are relative to sea level. Topographic notes. Topographic Map-includes contour lines drawn to represent changes in elevation.. Topographic maps take 3 dimensional ups and downs of the terrain and show them on 2 dimensional surface.. Aim: To be able to interpret a topographic Map.. What is a Topographic Map?. A topographic map. shows surface features,. or topography, of the . Earth. . Topography can be natural or human-made. interpret topographic maps and satellite views to identify land and erosional features and predict how these features may be reshaped by weathering. A 2D view of a 3D surface. How. do topographic maps give you a picture of what the landscape looks like?. a ridge. a valley. g. oing uphill. closer . contours. = steeper slope. contours farther apart = shallower slope. Imagine that the red line represents a geologic contact of some sort. Given that it doesn’t parallel contours we know it isn’t horizontal, and given that it doesn’t cut straight across contours we know it isn’t vertical. Can we tell something about its orientation? . 1. Attendance / seating chart. Say hi to MR. . BEAN : ). Notes on Density . Worksheet. Begin Lab if time??. Lat. /Long. Time Zones. Contour maps. Today . 10/9/14 . period . 7. Attendance/Seating Chart. After . Unit . 4 you should be able to:. Accurately write coordinates. Use a map containing latitude and longitude. Determine latitude using the altitude of Polaris. Determine differences in time zones. Visualizing 3D Surfaces. Carol J. Ormand. , . SERC, Carleton College. Eric Riggs, Texas A&M University. Overview. What do we mean when we talk about “reading” contour maps?. Example: the Topographic Map Assessment.

Download Document

Here is the link to download the presentation.
"This is a topographic contour base map we will use to explo"The content belongs to its owner. You may download and print it for personal use, without modification, and keep all copyright notices. By downloading, you agree to these terms.

Related Documents