/
Use of Total Lightning Data at Use of Total Lightning Data at

Use of Total Lightning Data at - PowerPoint Presentation

debby-jeon
debby-jeon . @debby-jeon
Follow
404 views
Uploaded On 2016-11-26

Use of Total Lightning Data at - PPT Presentation

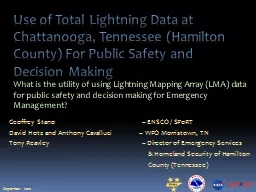
Chattanooga Tennessee Hamilton County For Public Safety and Decision Making What is the utility of using Lightning Mapping Array LMA data for public safety and decision making for Emergency Management ID: 493463

data lightning lma total lightning data total lma cloud sport ground public safety decision flash display access observes nws

Share:

Link:

Embed:

Download Presentation from below link

Download Presentation The PPT/PDF document "Use of Total Lightning Data at" is the property of its rightful owner. Permission is granted to download and print the materials on this web site for personal, non-commercial use only, and to display it on your personal computer provided you do not modify the materials and that you retain all copyright notices contained in the materials. By downloading content from our website, you accept the terms of this agreement.


Presentation Transcript

Slide1

Use of Total Lightning Data at Chattanooga, Tennessee (Hamilton County) For Public Safety and Decision MakingWhat is the utility of using Lightning Mapping Array (LMA) data for public safety and decision making for Emergency Management?

Geoffrey Stano – ENSCO / SPoRTDavid Hotz and Anthony Cavalluci – WFO Morristown, TNTony Reavley – Director of Emergency Services & Homeland Security of Hamilton County (Tennessee)

September 2012Slide2

The Lightning Mapping Array (LMA) observes the individual stepped leaders of the entire flash, also called sources

Observes flashes not detected by the NLDNObserves intra-cloud and cloud-to-ground lightning Related to the strength of storm

What is Meant by Total Lightning?Slide3

This is a collaboration project between ENSCO/

SPoRT, NWS Morristown, Tennessee, and Chattanooga EMA to evaluate the usefulness of using LMA data at the local Emergency Management (EM) level for public safety. The local EM will have access to the latest LMA output to aid in public safety decisions. We will stress to the EM that the total lightning data is experimental and should be used in conjunction with other preparedness tools, such as the doppler radar.Before and during the project, ENSCO/SPoRT and NWS will provide training to the local EM on the best ways to evaluate the total lightning data.What is the Purpose of the Study?Slide4

Why Focus on Chattanooga?

NALMA DomainNo CoveragePartial Coverage

Full CoverageSlide5

What is the Practical

Benefit of Total Lightning?Intra-cloud lightning generally occurs between 5 and 10 minutes before Cloud to Ground LightningSource density “jump” noted in advance of many severe weather occurrencesSlide6

Benefit: Lead time for first Cloud-to-Ground

Time (min)

Number of Storms

First IC to First CG Delay

“First Strike” Forecasting

90% of lightning intra-cloud

Lead time for initial cloud-to-ground strike

First IC typically precedes first CG by 5-10 min

Aviation applications

Update TAFs

Airport Weather

Warnings

Public service applicationsSlide7

Benefit: Spatial Extent

Lightning Awareness

Total lightning not a point observation

Observes spatial extent

Lightning may extend many miles from storm’s core

Typical Horizontal Extent

Within 10 miles

40 km FlashSlide8

We need your evaluation of Total Lightning Data and the Display

Some potential evaluation questions:Want to get a sense of the pros and cons of the current lightning data. How to improve the display GUI? Is the lightning data valuable to your operations and decision making? If so, how did you use the

data? Are there other EMA operations this can be used with?Slide9

Increased Awareness of Total Lightning Activity can Save Lives

Outside Sport ActivitiesDecision Support ServicesOutside Summer EventsSlide10

Tools for Viewing Total Lightning Data

Traditional Paradigm

AWIPS

Main NWS decision support system

EMA does not have this

Solution

Web-based product

LMA+radar+NLDN

in AWIPSSlide11

Current Web Display

Excellent page for overview

Browse past events

Main issue for project

10 min summaries

No animationSlide12

How Do You Access the Total Lightning Data

NASA SPoRT has developed on-line access to the total lightning data. The link is the following:http://weather.msfc.nasa.gov/sport/lma/nalma.htmlThe internet access is a Google Earth page. The page will overlay the data over Google Earth allowing you to zoom in and out of the area of interest. Slide13

Example Output of Total Lightning DataHow to Read the Data

Data is updated every 2 minutes.Source Density Scale:Measures the number of sources (pieces of a lightning flash) over the past 2 minutes.Source Density Data on October 7th, 2009 between 0600-0630 UTCSlide14

Future of Total Lightning Data

The LMAs have a short range of no more than 200 km. This is being addressed with the next generation geostationary satellite, GOES-R, which will boast the Geostationary Lightning Mapper (GLM). SPoRT, in conjunction with NOAA’s GOES-R Proving Ground, is working to prepare the end user community for the GLM era using the LMA observations as a demonstration tool. Working collaboratively with our NWS partners, SPoRT is working to determine how best to integrate these future observations to improve both severe storm warnings and lightning safety. Slide15

Future of Total Lightning Data

Pseudo-GLM (PGLM)

Demo tool of future GLM observations

Uses LMA data

10 km resolution

AdvantagesFlash-based productLearn operational uses now ahead of GOES-R launch

PGLM Flash Density

(Chattanooga-centered Google Earth display)