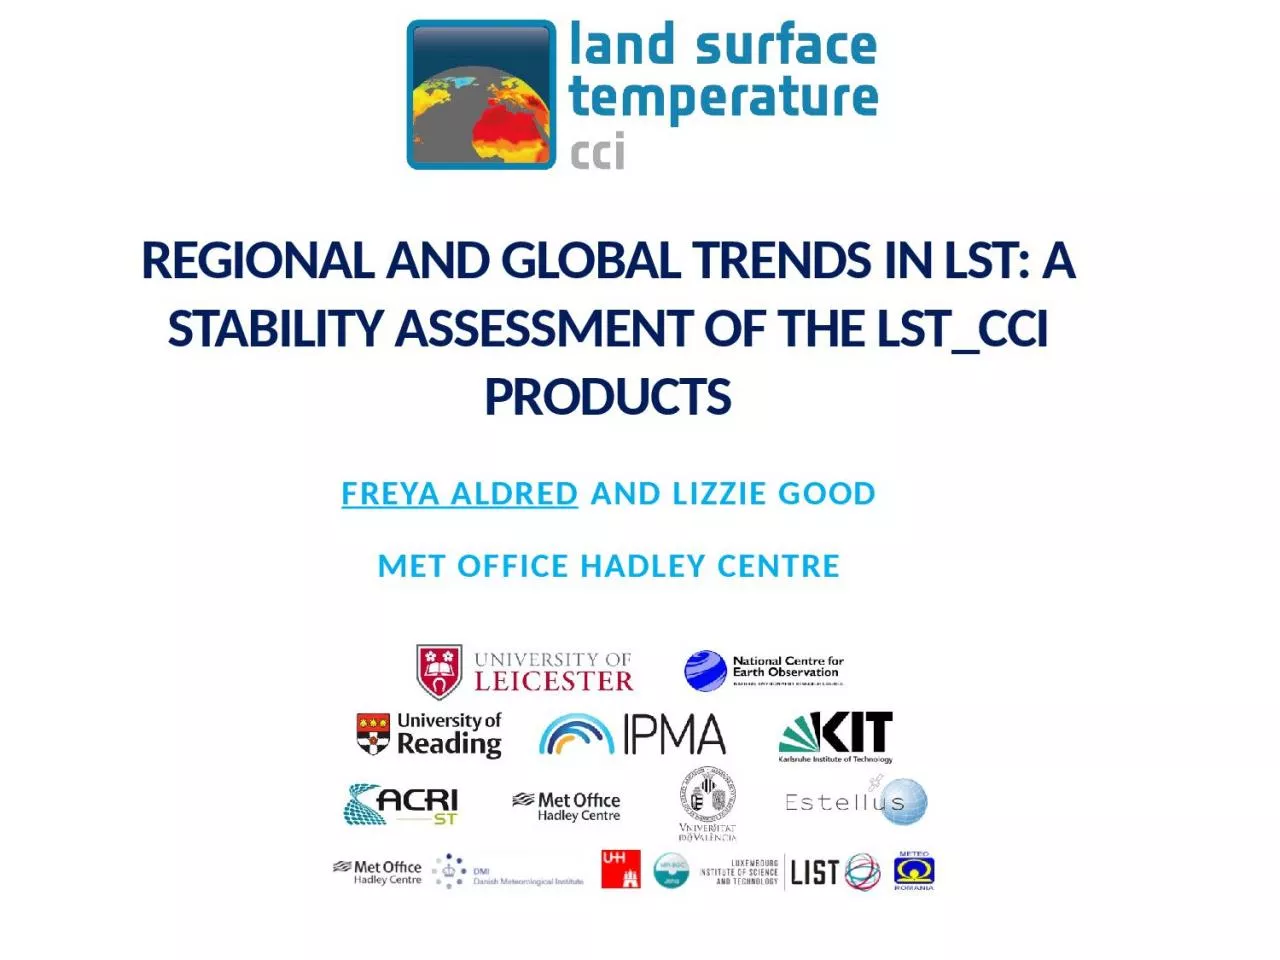
/
Regional and global trends in LST: A Stability Assessment of the Regional and global trends in LST: A Stability Assessment of the

Regional and global trends in LST: A Stability Assessment of the - PowerPoint Presentation

desha
desha . @desha
Follow
66 views
Uploaded On 2023-10-04

Regional and global trends in LST: A Stability Assessment of the - PPT Presentation

LSTcci Products Freya Aldred and Lizzie Good Met Office Hadley Centre Motivation Trends in 2m air temperature T2m are well established Obtained from network of weather stations sparse in some regions ID: 1022295

data lst trends t2m lst data t2m trends cci anomaly time overpass relationship sensor station atsr stations calculated analysis

Share:

Link:

Embed:

Download Presentation from below link

Download Presentation The PPT/PDF document "Regional and global trends in LST: A Sta..." is the property of its rightful owner. Permission is granted to download and print the materials on this web site for personal, non-commercial use only, and to display it on your personal computer provided you do not modify the materials and that you retain all copyright notices contained in the materials. By downloading content from our website, you accept the terms of this agreement.


Presentation Transcript

1. Regional and global trends in LST: A Stability Assessment of the LST_cci ProductsFreya Aldred and Lizzie GoodMet Office Hadley Centre

2. MotivationTrends in 2m air temperature (T2m) are well establishedObtained from network of weather stations – sparse in some regionsSatellite observed LST may be useful to complement T2m observationsIndependent information on changes in surface temperatureTo date hindered by lack of long term, stable LST climate data records[https://www.metoffice.gov.uk/hadobs/crutem4/]

3. This StudyAims:Calculate global and regional trends using the LST_cci productsCompare with equivalent trends in T2mThis presentation:Explore relationship between collocated LST_cci and T2m anomaly data​Stability assessment of LST_cci data​Preliminary look at trends in LST_cci data

4. The Data - LSTLST_cci InfraRed (IR) datasets:Day and night overpasses for all IR instruments, time of overpass is different for each instrument, but it is stable within an instrument's lifetimeCDR contains ATSR-2 and AATSR data, with ATSR-2 overpass times corrected to AATSR overpass time, which is around 30 minutes differentData are all at 0.05 degrees resolutionERS-S ATSR-2August 1995 – June 2003Envisat AATSRJuly 2002 – April 2012Terra MODISFebruary 2000 – December 2018Aqua MODISJuly 2002 – December 2018Multi-sensor IR Climate Data Record (CDR) (ATSR series)August 1995 – March 2012

5. The Data - LSTLST_cci MicroWave (MW) datasets:MW instruments are classified by ascending and descending orbitsThe overpass time drifts throughout operational lifetimeThe light blue box indicates the time range of data usedData from F-13, F-17 and F-18 are included in the datasetData are all at 0.25 degrees resolution[http://www.remss.com/support/crossing-times/]Multi-sensor MW CDR (SSMI/SSMIS)January 1995 – December 2018

6. The Data – T2mEU Surface Temperature for All Corners of Earth (EUSTACE) homogenised station 2m air temperature (T2m) dataHomogenised time series of daily temperature observations for meteorological stations throughout Europe and the MediterraneanCorrected to remove non-climatic discontinuities such as those from a change in station location[https://catalogue.ceda.ac.uk/uuid/81784e3642bd465aa69c7fd40ffe1b1b]Based on the European Climate Assessment & Dataset (ECA&D) daily datasetTmin, Tmean and Tmax for each stationVery high density of stations in Germany

7. Data ProcessingGridded LST products are spatially co-located with EUSTACE station locationsTmin, Tmax and Tmean time series are created with the T2m and LSTmin, LSTmax, LSTmean time series created with LST dataLSTmax is extracted from the daytime overpass and LSTmin from the night time overpass, LSTmean is then calculated as the mean of these two valuesFOR MW data, the descending overpass (~6-8 am) is matched with Tmax and the ascending overpass (~6-8 pm) is matched to TminLikely move to focusing on LSTmean / Tmean data

8. Anomaly CalculationsClimatologies (baseline climate conditions)Calculated for LST and T2m separatelyFor each station locationFor each satellite time period (for LST and T2m so they are equivalent)Based on a 31 day moving mean window calculated each calendar day of the year (this is to ensure a sufficient data pool and smoothing)AnomaliesThe median climatology is subtracted from the station data to calculate the anomalies:LSTanom = LSTobserved – LSTclimatologyT2manom = T2mobserved – T2mclimatology

9. Relationship BetweenLST and T2m Anomaliesat Each Station Location

10. LSTanom vs T2manomExample relationship between LSTanom and T2manom for Aqua MODISA perfect relationship would have a correlation r value of 1, the slope of the best fit line would be 1, and the intercept would be 0Correlation is the r valueSlope refers to the slope of the best fit line of the relationshipIntercept is the intercept of this line

11. Anomaly Relationship- MODISBoth MODIS instruments have correlation values with T2m around 0.8, which decreases at higher latitudes during the dayLST vs T2m slope around 0.8Intercept generally around 1 K at night, -2 to -1 K in the day, which becomes more positive with increasing latitude

12. Anomaly Relationship- ATSR InstrumentsFor the ATSR data sets there are very few data pointsCorrelations and relationship slopes are lower, around 0.6 – 0.7 and 0.5 – 0.7 respectively

13. Anomaly Relationship- Multi-sensor MW CDRSimilar results are found for the MW LST product to MODISSlopes and intercepts are more stable with latitudeIntercepts are nearly all negative

14. Stability Analysis

15. Stability Analysis- MethodObservations are only used where both LST and T2m anomalies are availableThe high density of stations found in Germany in the EUSTACE dataset is reflected in the anomaly match ups for MODIS instruments and the MW productThere are very few match ups for the ATSR instruments, partially because very few station locations have enough data to create the climatologiesMonthly mean anomalies are calculated for LST and T2mThese are spatially averaged in different ways e.g. over all of Europe, for each country, and for data in 5 degree latitude bandsDifferences are calculated as:Differenceanom = LSTanom – T2manom

16. Anomaly Differences- Multi-sensor IR CDRLST and T2m follow same shape in monthly meansCorrelation in monthly means higher for TminERS-2 and Envisat display different pattern in differencesVisually obvious for TminStandard deviation is higher for ERS2 than Envisat (note ERS2 is corrected to Envisat overpass time)Suggests data is not free from non-climatic effects and cannot be used for trend analysis

17. Anomaly Differences- Multi-sensor MW CDRLST and T2m monthly means generally have a very similar shapeEvidence of sensor drift in differencesDifference plots show different characteristics for each sensorIt is clear where the sensor changes happen in the dataset visuallyStandard deviations vary for each sensorSuggests dataset is not free from non-climatic effects and cannot be used for trend analysis

18. Preliminary Look at Trends

19. Anomaly Trends- EUSTACE T2mMost stations have positive trends between 0 and 1 K / decade95% confidence intervals are mostly narrow and do not cross zero – these trends are statistically significantSome stations are distinct outliers and have much wider confidence intervals

20. Trends are between 0 and 2 K / decade - larger than the T2m trendsConfidence intervals around 0.5 – 1 K / decade and generally don’t cross zeroTrends approach zero towards higher latitudesSimilar results for TerraAnomaly Trends- LST_cci MODIS

21. SummaryGenerally good correlation between LST and T2m anomalies​Encouraging in terms of quality of LST_cci data sets and for the use of LST to complement T2m analyses​Multi-sensor products show non-climatic discontinuities between different sensors, and drift in MW dataWe know IR CDR beta release has only been partly homogenised; the first official release will be much improved in this respectWe also know work is ongoing to look at drift in the MW LST dataThe current versions cannot be used for trend analysisPreliminary trend analysis of MODIS LST_cci data set looks promising​Generally similar trends in LST and T2m anomalies