/
The MODIS The MODIS

The MODIS - PowerPoint Presentation

lindy-dunigan
lindy-dunigan . @lindy-dunigan
Follow
374 views
Uploaded On 2016-04-04

The MODIS - PPT Presentation

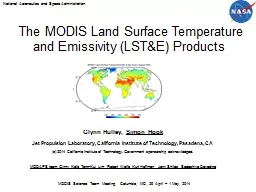
Land Surface Temperature and Emissivity LSTampE Products   Glynn Hulley Simon Hook Jet Propulsion Laboratory California Institute of Technology Pasadena CA c 2014 California Institute of Technology Government sponsorship acknowledged ID: 274026

emissivity mod21 modis lst mod21 emissivity lst modis surface mod11 land tes algorithm water amp band product uncertainty temperature validation window radiance

Share:

Link:

Embed:

Download Presentation from below link

Download Presentation The PPT/PDF document "The MODIS" is the property of its rightful owner. Permission is granted to download and print the materials on this web site for personal, non-commercial use only, and to display it on your personal computer provided you do not modify the materials and that you retain all copyright notices contained in the materials. By downloading content from our website, you accept the terms of this agreement.


Presentation Transcript

Slide1

The MODIS Land Surface Temperature and Emissivity (LST&E) Products 

Glynn Hulley, Simon HookJet Propulsion Laboratory, California Institute of Technology, Pasadena, CA(c) 2014 California Institute of Technology. Government sponsorship acknowledged.MODAPS team: Ginny Kalb, Teng-Kui Lim, Robert Wolfe, Kurt Hoffman, Jerry Shiles, Sadashiva Devadiga

National Aeronautics and Space Administration

MODIS Science Team Meeting, Columbia, MD, 29 April – 1 May, 2014Slide2

OutlineUse of LST&E products in Earth ScienceThe MOD21 LST&E product and applications

Comparisons with the MOD11 productValidation resultsSummarySlide3

IntroductionLine plot of global mean land-ocean temperature index, 1880 to present, with the base period 1951-1980. The dotted black line is the annual mean and the solid red line is the five-year mean. The green bars show uncertainty estimates.

[This is an update of Fig. 1A in Hansen et al. (2006).]Air temperatures used over landSlide4

Evapotranspiration

(drought monitoring)Surface Energy BalanceAtmospheric profile retrievals

Urban Heat Island Studies

Earth Science Use of LST&E

Understanding

Climate ChangeSlide5

The Importance of Record LengthSlide6

Total precipitable water (TPW) images in mm retrieved from MODIS over North Africa using two approaches in the training dataset,(a) Fixed emissivity = 0.95,

(b) MODIS Baseline-fit Emissivity Database (Wisconsin)(c) Standard NCEP GDAS product Using a constant emissivity, TPW values are noisy and overestimated by up to 90 mm over regions of North Africa (Seemann et al. 2008), while using a physically retrieved emissivity results in a close agreement with NCEP GDAS product.TPWSlide7

MODIS LST Products

Product LevelDimensionsSpatialResolutionTemporal ResolutionAlgorithmOutputProductsMOD11_L2L22030 lines1354 pixels/line1km at nadirSwath2x dailySplit-Window- LSTMOD11B1

L3200 rows200

columns~5 km (C4)~6 km (C5)Sinusoidal

2x dailyDay/Night- LST- Emissivity(bands 20-23, 29, 31,32)MOD11C3

L3

360ºx180º

Global

0.05º x 0.05º

Monthly

Day/Night

+ Split-Window

- LST

- Emissivity

(bands 20-23, 29, 31-32)

MOD21_L2

L2

2030 lines

1354 pixels/line

1km

at nadir

Swath

2x daily

8-day

TES

- LST

- Emissivity

(bands 29, 31,

32)

Current MODIS

LST&E ProductsSlide8

The MOD21 & ASTER Temperature Emissivity Separation (TES) Algorithm Basics

Atmospheric Parameters: , , Estimated with MODTRAN (5.2)

Surface Radiance

:

Observed Radiance

Calibration curve for MODIS bands 29, 31, 32:Slide9

MODIS profiles (MOD07)Cloud mask (MOD35)

MOD/MYD02-1KMRadiance at SensorTIR Destriping algorithm Atmospheric CorrectionMODTRAN 5.2Water Vapor Scaling (WVS)Temperature Emissivity Separation Algorithm (TES)MOD21 Output:

(1 km) Emissivity (TIR bands 29, 31, 32)

Land Surface Temperature (LST) Uncertainty Data Planes

τ - TransmissivityL↑ - Path radiance

L

- Sky irradiance

EMC/WVS Coefficients

Vegetation

indices

(MOD13A2)

Snow/water/ice (MOD10)

Total Column Water (MOD07)

τ

- transmissivity

L’

- Path radiance

L’

- Sky irradiance

Surface Radiance Estimation

START

Geolocation

(MOD03)

Snow/water/ice (MOD10)

>99.5% water?

EXIT

MOD21 Algorithm ArchitectureSlide10

Motivation for a Physically Retrieved MODIS LST and Emissivity Product

Mauna Loa Caldera, Hawaii Mafic lava flow (basalt)

3 km

Average temperatures over Caldera

ASTER TES: 322 ±1 K

MODIS TES (MOD21): 324 ±0.8 K

MOD11_L2: 310 ±0.5 K Slide11

Split-Window versus TES physical retrieval

MOD11 classified as bare and assigned single emissivity but a wide range in emissivity as seen with MOD21 (TES)Split-window:MOD11 band 31 (11 µm)TES Retrieval:MOD21 band 31 (11 µm)

11

e = 0.96

e = 0.981

e = 0.943

T = ~5 K!Slide12

Generated

using prototype MOD21 algorithm at MODAPSSlide13

Generated

using prototype MOD21 algorithm at MODAPSSlide14

Generated

using prototype MOD21 algorithm at MODAPSSlide15

MOD21 emissivity can be used for surface composition studies and monitoring land cover changeSlide16

Desertification monitoring with

MOD21 band 29 emissivityMOD21 band 29 emissivity sensitive to background soil and dry/green vegetationNDVI unable to make distinction between background soil and dry vegetationMOD21 emissivity able to better capture seasonal trends and interannual trends than NDVI

Hulley, G., S. Veraverbeke, S. Hook, (2014), Thermal-based techniques for land cover change detection using a new dynamic MODIS multispectral emissivity product (MOD21), Rem. Sens. Environ, 140, p755-765

Jornada

Experimental Range, New Mexico

Land degradation

RecoverySlide17

Difference between MOD21 band 31 and 32 emissivity can be used for distinguishing between snow, ice and waterSlide18

Time series of MOD21 emissivity (b32 – b31) able discriminate in more detail different melt and freeze phases on glaciers and ice sheets than traditional albedo approaches

Hulley, G., S. Veraverbeke, S. Hook, (2014), Thermal-based techniques for land cover change detection using a new dynamic MODIS multispectral emissivity product (MOD21), Rem. Sens. Environ, 140, p755-765WaterFineMediumCoarseIcee32-e31Slide19

Well characterized uncertainties!

MOD21 Science Data SetsSlide20

MOD21 has well defined Quality Control (QC) parameters based on TES algorithm outputs

MOD21 QCSlide21

MOD21 Uncertainty Modeling

ai = regression coefficients dependent on surface type (gray, bare, transition)SVA = sensor view angleTCW = total column water estimate (cm), e.g. from MOD07, NCEP

TCW

Hulley, G. C., T. Hughes, and S. J. Hook (2012), Quantifying Uncertainties in Land Surface Temperature (LST) and Emissivity Retrievals from ASTER and MODIS Thermal Infrared Data, J.

Geophys. Res. Lett, 117, D23113, doi:10.1029/2012JD018506.

Important for climate modelsSlide22

MOD21 LST&E Retrievals with Uncertainty

LSTLSTUncertainty

Emissivity

Uncertainty

Emissivity

Band 29Slide23

LST

Uncertainty (K)

Surface

type

Emissivity Samples

Simulations

MOD21

(3-band TES

)

RMSE

(Bias)

MOD11

(2-band Split-Window

)

RMSE

(Bias)

VIIRS

(2-band Split-Window

)

RMSE

(Bias)

Vegetation

, Water,

Ice

, Snow

8

660,096

2.19

(0.66)

1.59

(-0.53)

1.77

(-0.97)

Rocks

48

3,960,576

1.44

(-0.73)

4.31

(-3.32)

4.29

(-3.69)

Soils

45

3,713,040

0.89

(0.09)

1.27

(-0.25)

1.81

(-1.43)

Sands

10

825,120

1.12

(-0.12)

2.38

(-1.79)

3.11

(-2.69)

Total

111

9,158,832

1.49

(-0.24)

2.66

(-1.85)

2.93

(-2.49)

TES (MOD21)

vs

Split-window (MOD11, VIIRS) Uncertainty Analysis

MOD21 has slightly larger scatter over graybodies, but lowest Uncertainty on average by more than 1 K over all surface types compared to split-window approachesSlide24

JPL LST&E Validation Sites24Slide25
Slide26

MODIS LST Validation: Greenland ice sheet

Similar accuracy over Greenland (<1 K) Slide27

MODIS LST Validation:

Great Sands, Colorado** Radiance-based LST validation using lab-measured sand samples collected at dune siteSlide28

 Sites

ObsMOD11

MOD21


MOD11

MOD21

Bias (K)

RMSE (K)

Algodones,

CA

956

-2.89

-0.05


3.04

1.07

Great

Sands,

CO

546

-4.53

-0.93

4.63

1.17

Kelso,

CA

759

-4.55

-1.48

4.62

1.67

Killpecker, WY

463

-4.51

-1.19


4.58

1.42

Little

Sahara, UT

670

-3.71

-0.60


3.79

0.89

White

Sands,

NM

742

-

0.73

-0.29


1.07

0.95

MOD11 C5

cold bias of up to ~5 K over bare sites

(due to overestimated classification emissivity)

MOD21/MOD11

LST Validation summary:

Bare surfaces (pseudo-invariant sand sites)Slide29

Future Work and SummaryMOD21 PGE in final stages of testing and development in preparation for Collection 6Reprocessing of MODIS Terra/Aqua to begin May/JuneDevelopment and optimization of MOD21 algorithm will continue under NASA TERAQ award from 2014-2016MOD21 LST&E products are physically retrieved with TES algorithm resulting in similar accuracy (<1.5 K) over all land cover types and a dynamic spectral emissivity product for detection and monitoring of landscape changes

A unified MOD21/MOD11 LST product is in production for a NASA MEaSUREs projectSlide30

National Aeronautics and Space AdministrationJet Propulsion LaboratoryCalifornia Institute of TechnologyPasadena, California

www.nasa.govThe EndSlide31

Surface

EmissionSurfaceReflection

Skin Temperature & Surface Emissivity

Thermal Infrared Radiative Transfer

Surface Radiance

Atmospheric Emission

Sensor

Radiance

Emissivity

Land Surface Temperature (LST)

Transmissivity

Sky irradiance

Path radianceSlide32

ASTER

Classification emissivity (MOD11, VIIRS)

are set too high over bare surfaces, only Physical algorithms (MOD21, ASTER) able to retrieve correct spectral shape (more bands the better).Slide33

MODIS Emissivity Validation:

Great Sands, ColoradoMOD11 classification set too high resulting in cold LST bias (>2-5 K)Slide34

MOD21/MOD11 LST Validation summary:

Graybody surfaces (forest, snow/ice, grassland)MOD21 and MOD11 have similar accuracy over graybody surfaces (<1 K)