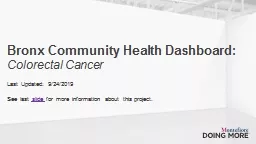
Other Cancers Last Updated 9242019 See last slide for more information about this project About this dashboard Lung colorectal prostate breast and gynecologic cancers ie uterine cervical and ovarian are presented in individual dashboards available at ID: 812917
Download The PPT/PDF document "Bronx Community Health Dashboard:" is the property of its rightful owner. Permission is granted to download and print the materials on this web site for personal, non-commercial use only, and to display it on your personal computer provided you do not modify the materials and that you retain all copyright notices contained in the materials. By downloading content from our website, you accept the terms of this agreement.
Slide1
Bronx Community Health Dashboard:
Other Cancers
Last Updated:
9/24/2019
See last
slide
for more information about this project.
Slide2About this dashboard
Lung, colorectal, prostate, breast and gynecologic cancers (i.e., uterine, cervical and ovarian) are presented in individual dashboards available at:
https://www.montefiore.org/population-health-dashboards
Data source: Global Burden of Disease Project, 2017.
Death and disability from other cancers
Detailed data are provided for cancers in red due to increasing trends or a higher burden in the Bronx
Incidence and mortality rates
by borough are shown for the
remaining cancers
Disability-Adjusted Life Years (DALYs) are calculated by adding the Years of Life Lost due to premature mortality in the population and the Years Lost due to Disability for people living with the health condition or its consequences.
Slide4Pancreatic cancer incidence
Slide5Pancreatic cancer rates are about average in the Bronx, but for men are the highest among all NYC boroughs
Data source: New York State Cancer Registry, 2012-2016.
Slide6Data source: New York State Cancer Registry, 1976-2016.
Pancreatic cancer rates have remained relatively stable for men, increasing slightly recently; for women, there is a modest increase
Slide7In the Bronx, the pancreatic cancer rate is highest among non-Hispanic black men
Data source: New York State Cancer Registry, 2012-2016.
Slide8Mortality from pancreatic cancer
Slide9Mortality rates from pancreatic cancer are a bit above average in the Bronx
Data source: New York State Cancer Registry, 2012-2016.
Slide10Data source: New York State Cancer Registry, 1976-2016.
Among Bronx men, mortality rates from pancreatic cancer declined, but experienced a recent uptick; rates have increased slightly for Bronx women
Slide11In the Bronx, the mortality rate from pancreatic cancer is highest among non-Hispanic white men
Data source: New York State Cancer Registry, 2012-2016.
Slide12Liver cancer incidence
Slide13Men in the Bronx have liver cancer rates 50% higher than NYC overall; rates for women are also elevated
Data source: New York State Cancer Registry, 2012-2016.
Slide14Data source: New York State Cancer Registry, 1976-2016.
Liver cancer rates have increased for both sexes in the Bronx; the biggest increase was among men
Hepatitis C rates rose substantially in the 20
th
century due to improvements in diagnosis after the discovery of hepatitis C virus in 1989, as well as a combination of intravenous drug use and reused but poorly sterilized medical equipment.
Slide15In the Bronx, the liver cancer rate is highest among Hispanic men
Data source: New York State Cancer Registry, 2012-2016.
Slide16Mortality from liver cancer
Slide17The mortality rate from liver cancer is 57% higher among Bronx men than men in NYC overall
Data source: New York State Cancer Registry, 2012-2016.
Slide18Data source: New York State Cancer Registry, 1976-2016.
Mortality rates from liver cancer have increased for both sexes in the Bronx and NYC overall, with larger increases among men
Slide19In the Bronx, the mortality rate from liver cancer is highest among Hispanic men
Data source: New York State Cancer Registry, 2012-2016.
Slide20Esophageal cancer incidence
Slide21Men in the Bronx have the second highest esophageal cancer rate in NYC
Data source: New York State Cancer Registry, 2012-2016.
Slide22Data source: New York State Cancer Registry, 1976-2016.
Esophageal cancer rates have declined for both sexes in the Bronx and NYC overall
Slide23In the Bronx, the esophageal cancer rate is highest among non-Hispanic white men
Data source: New York State Cancer Registry, 2012-2016.
Slide24Mortality from esophageal cancer
Slide25Bronx men have the highest mortality rate from esophageal cancer
Data source: New York State Cancer Registry, 2012-2016.
Slide26Data source: New York State Cancer Registry, 1976-2016.
Mortality rates from esophageal cancer have declined for both sexes in the Bronx and NYC overall
Slide27In the Bronx, the mortality rate from esophageal cancer is highest among non-Hispanic white men
Data source: New York State Cancer Registry, 2012-2016.
Slide28Larynx cancer incidence
Slide29Bronx men have the highest larynx cancer rate
Data source: New York State Cancer Registry, 2012-2016.
Slide30Data source: New York State Cancer Registry, 1976-2016.
Larynx cancer rates have declined for both sexes, but remain higher for men, in the Bronx and NYC overall
Slide31In the Bronx, the larynx cancer rate is highest among Hispanic men
Data source: New York State Cancer Registry, 2012-2016.
Slide32Mortality from larynx cancer
Slide33Bronx men have the highest mortality rate from larynx
cancer among NYC boroughs
Data source: New York State Cancer Registry, 2012-2016.
Slide34Data source: New York State Cancer Registry, 1976-2016.
Mortality rates from larynx cancer have declined for both sexes, but remain higher for men, in the Bronx and NYC overall
Slide35In the Bronx, the mortality rate from larynx cancer is highest among non-Hispanic black men
Data source: New York State Cancer Registry,
2012-2016
.
Slide36Leukemia incidence and mortality
Slide37Leukemia rates are slightly below average in the Bronx
Data source: New York State Cancer Registry, 2012-2016.
Slide38Mortality rates from leukemia are
about average
in the Bronx
Data source: New York State Cancer Registry, 20102-2016.
Slide39Non-Hodgkin lymphoma incidence and mortality
Slide40Non-Hodgkin lymphoma rates in the Bronx are about
average
Data source: New York State Cancer Registry, 2012-2016.
Slide41Bronx men have the second highest mortality rate from non-Hodgkin
lymphoma among NYC boroughs
Data source: New York State Cancer Registry, 2010-2014.
Slide42Brain cancer incidence and mortality
Slide43Brain cancer rates are lowest in the Bronx as compared to other NYC boroughs
Data source: New York State Cancer Registry, 2012-2016.
Slide44Mortality rates from brain cancer are
about average
in the Bronx as compared to other NYC boroughs
Data source: New York State Cancer Registry, 2012-2016.
Slide45Kidney cancer incidence and mortality
Slide46Men in the Bronx have the second highest kidney cancer incidence rate among NYC boroughs
Data source: New York State Cancer Registry, 2012-2016.
Slide47Men in the Bronx have the highest mortality rate from kidney cancer compared to other NYC boroughs
Data source: New York State Cancer Registry, 2012-2016.
Slide48Stomach cancer incidence and mortality
Slide49Among women, stomach cancer rates in the Bronx are slightly higher compared to NYC overall but about average among men
Data source: New York State Cancer Registry, 2012-2016.
Slide50For women, mortality
rates from stomach cancer are slightly above average in the Bronx
Data source: New York State Cancer Registry, 2012-2016.
Slide51Bladder cancer incidence and mortality
Slide52Bladder cancer rates are lowest in the Bronx as compared to other NYC boroughs
Data source: New York State Cancer Registry, 2012-2016.
Slide53Mortality rates from bladder cancer are about average in the Bronx
Data source: New York State Cancer Registry, 2012-2016.
Slide54Melanoma incidence and mortality
Slide55Melanoma rates are highest in the Bronx as compared to other NYC boroughs
Data source: New York State Cancer Registry, 2012-2016.
Slide56The melanoma mortality rate is
slightly above
average in the Bronx
Data source: New York State Cancer Registry, 2012-2016.
Slide57Myeloma incidence and mortality
Slide58Bronx men have the highest myeloma rates compared to other NYC boroughs
Data source: New York State Cancer Registry, 2010-2014.
Slide59Men in the Bronx have the highest mortality rate from myeloma
Data source: New York State Cancer Registry, 2010-2014.
Slide60Oral cavity and pharynx cancer incidence and mortality
Slide61Bronx men have the second highest oral cavity and pharynx cancer
rate among NYC boroughs
Data source: New York State Cancer Registry, 2012-2016.
Slide62Men in the Bronx have the highest mortality rates from oral cavity & pharynx cancer, while for women the rate is about average
Data source: New York State Cancer Registry, 2012-2016.
Slide63Thyroid cancer incidence
Slide64Thyroid cancer rates are the lowest in the Bronx as compared to other NYC boroughs
Data source: New York State Cancer Registry, 2012-2016.
Slide65Hodgkin lymphoma incidence
Slide66Hodgkin lymphoma rates are about average in the Bronx
Data source: New York State Cancer Registry, 2012-2016.
Slide67Testicular cancer incidence
Slide68The Bronx has the lowest testicular cancer rate in NYC
Data source: New York State Cancer Registry, 2012-2016.
Slide69About the Community Health Dashboard Project
The goal of the project is to provide Bronx-specific data on risk factors and health outcomes with an emphasis on presenting data on trends, socio-demographic differences (e.g., by age, sex, race/ethnicity, etc.) and sub-county/neighborhood level data
Data will be periodically updated as new data becomes available.
Produced by Montefiore’s Office of Community & Population Health using publicly-available data sources
For more information please contact us at
OCPHDept@montefiore.org