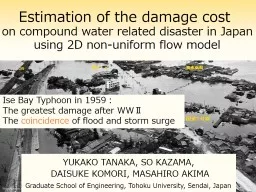
Ise Bay Typhoon in 1959 The greatest damage after WWⅡ The coincidence of flood and storm surge on compound water related disaster in Japan using 2D nonuniform flow model ID: 791531
Download The PPT/PDF document "http://www.d1.dion.ne.jp/~kwx/isewan.htm" is the property of its rightful owner. Permission is granted to download and print the materials on this web site for personal, non-commercial use only, and to display it on your personal computer provided you do not modify the materials and that you retain all copyright notices contained in the materials. By downloading content from our website, you accept the terms of this agreement.
Slide1
http://www.d1.dion.ne.jp/~kwx/isewan.htm
Ise
Bay Typhoon in
1959:The greatest damage after WWⅡThe coincidence of flood and storm surge
on compound water related disaster in Japan
using 2D non-uniform flow model
Estimation of the damage cost
YUKAKO
TANAKA, SO KAZAMA, DAISUKE KOMORI, MASAHIRO AKIMA
Graduate School of Engineering, Tohoku University, Sendai, Japan
Slide2・
Typhoons which brought
particularly
enormous damageBackground1A flood (Typhoon No. 18, 2015)Kinu
River burst its banks for the first time in 29 years
A flood
(Typhoon No. 10, 2016)
The typhoon hit the Tohoku district for the first time
Single disastersTyphoon Muroto (1934) Makurazaki Typhoon (1945)
Ise
Bay Typhoon (
1959
)
…
The
coincidence
of
Compound
disasters
flood
and storm surge
Slide3Background
2
http://311-ta--jinseidog.blogspot.jp/2014/07/blog-post_55.html
https://www.yodogawa.kkr.mlit.go.jp/activity/comit/develop/kisoan/glossary-ka.html>< It is necessary for Japan
enormous
damage
×
low probability
T
he risk ofcompound disastershigh probability
×
less damage
single
disasters
T
he risk of
to evaluate
quantitatively the
risk of
flood,
storm
surge, compound
disaster
a
nd compare them
or
Slide4Previous studies
3
Flood damage estimations using the
distribution of rainfall causing any return period of flood (Tezuka et al.,2014 etc.)
Analysis on storm surge inundation damage using
numerical models
(Suzuki, 2008 etc.)
Floods
Storm surges
Many studies have done on impacts on each flood and storm surge
Slide5Objectives
4
to calculate the inundation depth which is
storm surge
land
Sea area
land
inundation depth
Estimation on the damage cost
of compound disaster that flood and storm
surge happened
at the same
time
(
Akima
et al.
, 2016
)
!
T
he
inundation depth
was estimated on
the condition that highest tide level stay constant so far as the storm surge flooding
calculation
!
T
he
difference between the tide level and the ground elevation was regarded as the inundation depth of storm surge
The objective of my research
more
similar to the actual
phenomenon
Slide6Data set ~
single disasters~
5
Rainfall (mm/day)causing any return period of floodthe distribution of rainfall
・・・
96
Mean sea level
Tide
level deviation
Elaposedtime (hours)Tide level (m)
Floods
Any return
period
of
Storm surges
(
Tezuka
et al.,2014)
the
tide level
deviation calculated
by means
of frequency analysis
Slide7Data set ~
compound disasters~
6
Rainfall
・・・
96
Mean sea level
Tide level deviation
Tide level (m)
Tide level
Compound disaster
:
A
low pressure
bring flood
and storm
surge
one
after
another
at
the
same place
in 4 days
=
causing any return period
of
the rainfall
compound
disaster
c
aused by
any return period
of
the rainfall
low
atmospheric pressure
annual minimum
atmospheric pressure
(
hPa
)
annual minimum
atmospheric pressure
(
hPa
)
Tide
level
d
eviation (
cm
)
Rainfall
(mm/day
)
Elaposedtime
(hours)
Slide8Method
7
・Rainfall: 0~24h (constant)・Tide level:
0
~24h (time series)
prices per unit of area calculated by each land use
Tide
level (m) Inundation depth
Damage cost
Input to
Rainfall
(
mm/day
)
2D non-uniform flow model
Slide9Result ~
damage cost distribution~
8
Total amount of the potential damage costin whole Japan for 50-years return periodof compound disaster
75 trillion JPYMillion
=1,000,000 (0は6)1億 = 1,0000,0000 (0は8)Billion=
1,000,000,000 (0は9)1兆 =1,0000,0000,0000 (0は12)Trillion=1000,000,000 (0
は12)
P
otential damage cost (billion JPY)Potential damage cost (trillion JPY)compound disasterin
the part
of
the
compound disaster
e
ach event
flood
storm surge
Time
Flow
Slide10Result
~
difference in the time of storm surge~9Potential damage cost (billion JPY)The time set the highest tide level (hours)
Rainfall
tide level
Time
Time
Flow
Time
w
hen the damage cost of
compound
disaster
reaches a
peak
The
time
at that
the highest tide
level
is
set
30 hours after rain
started
3.7
trillion JPY
Slide11Result ~
difference from previous studies~
10
smaller by 13trillion JPYthe rate of decrease in damage cost
(%)
15.2
% decrease
The damage cost of compound disaster in this study is
smaller
than that in previous study (Akima et al., 2016) This difference could be caused by the difference in infiltrationof tidal waves to the land
Niigata, Ishikawa,
Kochi…particularly
overvalued
this study
previous study
Slide12Result~
comparing the risk of each event~
11
Useful for efficient adaptation method against water disasters80% of prefectures: Storm surge<Compound disaster<FloodFlood
Storm
surgeCompound disaster
Flood
Storm surge
Compound disaster
The greatest risk is brought by :annual expecteddamage cost
(
billion JPY
)
Annual
expected
damage cost
ware estimated
considering water disasters
control projects
Floods
pose
the
greatest risk
Slide13Conclusions
12
1
. Improvement of Flood simulationtime series variation of tide level was taken into the model2. Change in the arrival time of storm surge
3.
Comparison
of
the risk of each disaster
Storm surge
<Compound disaster<Floodto evaluate quantitatively the risk of water related disaster and compare themObjective
Results
damage
cost reaches
a peak on the condition
that
the
time of the highest tide level
is
set at 30
hours
after rain started
Slide14洪水寄与降雨
13
手塚ら,
2013日本全国の任意地点における再現期間降雨
上流
降水量
どの地点でも
100
年に
1回の流量
集水面積に応じ重みをつけた降雨→流量を適切に評価
?
?
?
1/100
1/100
1/100
×
重み
下流
再現期間の洪水を生じさせる降雨分布
集水面積と流出係数の関係
Slide15浸水深被害率曲線
田の浸水深被害率曲線
畑地
の浸水深被害率曲線家屋の浸水深被害率曲線家庭用品の浸水深被害率曲線14
Slide16頻度分析の方法 ~GEV
分布~
GEV分布…確率分布関数の一つ
15
(
のとき)
( のとき) ( 母数)
http://311-ta--jinseidog.blogspot.jp/2014/07/blog-post_55.html
最大値抽出などの水文頻度解析において重要な役割を
担
う
Slide17二次元不定流モデル
重力による影響
地表面の粗度による影響
家屋に
よる
抵抗
の影響
局所項
移流項16…連続方程式…運動方程式(x方向)
Slide18二次元不定流モデル
17
重力による影響
地表面の粗度による影響
家屋に
よる抵抗の影響
F =
m
a
Slide19二次元不定流モデル ~差分法~
18
…
連続方程式…運動方程式(x方向)