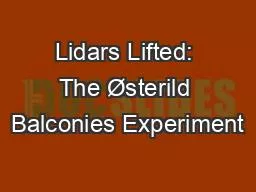
/
Lidars Lifted: The Østerild Balconies Experiment Lidars Lifted: The Østerild Balconies Experiment

Lidars Lifted: The Østerild Balconies Experiment - PowerPoint Presentation

eatfuzzy
eatfuzzy . @eatfuzzy
Follow
342 views
Uploaded On 2020-07-04

Lidars Lifted: The Østerild Balconies Experiment - PPT Presentation

Elliot Simon lt ellsimdtudk Observations lead the way Inflow measurements from Doppler lidar give temporal and spatial information about wind field behaviour upstream ID: 795682

val solidfill ufill srgbclr solidfill val srgbclr ufill typeface 000000 rpr strike nostrike spc lang ffffff latin verdana 1800

Share:

Link:

Embed:

Download Presentation from below link

Download The PPT/PDF document "Lidars Lifted: The Østerild Balconies E..." is the property of its rightful owner. Permission is granted to download and print the materials on this web site for personal, non-commercial use only, and to display it on your personal computer provided you do not modify the materials and that you retain all copyright notices contained in the materials. By downloading content from our website, you accept the terms of this agreement.


Presentation Transcript

Slide1

Lidars Lifted: The Østerild Balconies Experiment

Elliot Simon <

ellsim@dtu.dk

Slide2

Observations lead the way

Inflow

measurements from Doppler lidar give temporal and spatial information about wind field behaviour upstream of the turbineSome uses:Predictive turbine/farm control (yaw position, active power)Very short term energy production forecasts(dispatch, grid balancing)Extreme load avoidance (gusts, veer/shear)Blade impact erosion (hail, birds, heavy rain)

2

Slide3

Experiment Overview

Scientific questions:

Are horizontal wind field gradients homogeneous?

Can we measure and characterise terrain effects?Can we do anything meaningful with the inflow data?Horizontal scanning at 2 heightsPhase 1: 50m AGLPhase 2: 200m AGL4.25km distance between scannersPatchy forested terrain3V164-8MW (

Slide4

Site description: Terrain + tree height (m)

4

Slide5

Lifting procedure

5

https://www.youtube.com/watch?v=ZnkCuZG22YU

Do you even lift?

Slide6

Scan trajectory overview

Slide7

Dual Doppler transect line

7

Points on transect line are synchronised in time (not exactly in space)

Sampling rate = 49s (0.02 Hz)

Slide8

Introduction to plots

8

PPI videos

CNR filter (>-27 dB)

Slide9

Westerly gust (phase 2)

9

Gust is detected 10 minutes upstream

(4 → 11 m/s, cut in to rated power)

Slide10

10

Frontal boundary pass through (phase 1)

Slide11

11

Dual Doppler reconstruction of frontal event

Slide12

Mast data of event (June 6, 2016, 7PM CEST, UTC+2)

12

Slide13

Conclusions

13

400S EDFA gave

consistant 7km rangePPI scaning is probably enough for determining upstream conditions on 10 min scalesUpstream measurements do give useful information!Gust captured and tracked towards the ”turbine” over 10 minsColliding air masses observed over 2 hours with sudden extreme shear