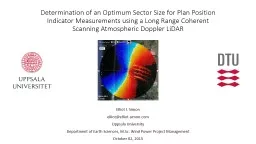
/
Determination of an Optimum Sector Size for Plan Position Determination of an Optimum Sector Size for Plan Position

Determination of an Optimum Sector Size for Plan Position - PowerPoint Presentation

natalia-silvester
natalia-silvester . @natalia-silvester
Follow
374 views
Uploaded On 2018-01-06

Determination of an Optimum Sector Size for Plan Position - PPT Presentation

Indicator Measurements using a Long Range Coherent Scanning Atmospheric Doppler LiDAR Elliot I Simon elliotelliotsimoncom Uppsala University Department of Earth Sciences MSc Wind Power Project Management ID: 620234

sector wind lidar size wind sector size lidar doppler speed range scanning long radial dual coherent time lidars area

Share:

Link:

Embed:

Download Presentation from below link

Download Presentation The PPT/PDF document "Determination of an Optimum Sector Size ..." is the property of its rightful owner. Permission is granted to download and print the materials on this web site for personal, non-commercial use only, and to display it on your personal computer provided you do not modify the materials and that you retain all copyright notices contained in the materials. By downloading content from our website, you accept the terms of this agreement.


Presentation Transcript

Slide1

Determination of an Optimum Sector Size for Plan PositionIndicator Measurements using a Long Range Coherent Scanning Atmospheric Doppler LiDAR

Elliot I. Simonelliot@elliot-simon.comUppsala UniversityDepartment of Earth Sciences, M.Sc. Wind Power Project ManagementOctober 02, 2015Slide2

BackgroundWhy do we need LiDARs?Limitations with in-situ measurements (particularly offshore)

Wind power projects growing in size, complexity and costComplex terrain and flowWind farm controlResearch (e.g. wakes, noise, loads, etc.)Development of long range WindScannerImprovements identified for commercial LiDARs

2010-14: DTU Development timelineGoal: Become standardised measurement device in wind energy industrySlide3

Motivation of StudyRUNE project: Near shore resource assessment using scanning LiDAR

Coastal zone atmospheric interactionsImprove wind atlases (i.e. NEWA)Two questions need to be answered!How many scanning LiDARs are necessary?In what configuration should they be placed?Thesis objective: Determine optimal PPI scanning strategies which will be implemented in RUNE and subsequent campaignsSlide4

Principles of Pulsed LiDARSame principles as radar, but using pulsed laser light

Laser beam (spatially and temporally coherent source) is emitted into the atmosphereAfter emission, the laser pulse interacts with micron sized aerosols suspended in the atmosphere (Mie scattering)The Doppler effect causes a shift in the pulse’s wavelength relative to the particle’s LOS velocitySlide5

Radial velocity samplingWind vector consists of 3 components (u, v, w)

Radial velocity is a projection of the true wind speed along the laser’s line of sightOne LiDAR can only measure a portion of the wind vector!Slide6

Principles of Pulsed LiDAR (contd.)A small portion of the pulses backscatter and land back on the LiDAR’s lens

The Doppler effect is used to obtain radial wind speeds from the backscattered signal (after FFT and MLE):On board signal processing includes time gating of the reflected pulses to measure multiple range gates (distances) along a single LOSUnfortunately it’s not that simple in practise..Coherent (optical heterodyne detection) which modulates CW LO to obtain beat signal, as opposed to direct detection

Eye safe(r), lower power, higher resolutionDual-axis beam positioning system (scanner head)Slide7

Long Range WindScanner SystemTwo parts:

Coherent Doppler scanning LiDAR (WindScanners)Master and client software utilising RSComPro, remotely administeredTogether represents a time and space synchronised long range coherent scanning multi-LiDAR array capable of complex measurement scenariosCurrent hardware modified from Leosphere WindCube 200S pulsed LiDARSlide8

WindCube 200S (Long Range WindScanner) HardwareSlide9

Plan Position Indicator

Fixed elevation angleAzimuth sweep with constant speed

Volume represents conical sectionSector size is the angular width

Measurements represent a (full/partial) sine wave

Amplitude = wind speed

Phase = wind direction

Offset = vertical velocity

Drawbacks:

Horizontal flow is assumed to be homogeneous

Elevation angle needs to be kept lowSlide10

Dual Doppler

2 LiDARs cross their beam simultaneously at a single point in space

Static or complex (dynamic)2 independent radial velocity measurements, still no vertical component

Pointing accuracy extremely important! (hard target calibration)Slide11

Why optimize sector size?Fixed measurement duration (movement and acquisition)

Trade off between sampled area and ratePotential benefits with a smaller sector size:Faster refresh rates over the area sampled, since the angular size is smallerImproved resolution by incorporating more line of sight measurements within the sector areaIncreased measurement distance, since more time could be spent on lengthening the reflected pulse acquisition timeBetter averaging (e.g. 10 minute) results due to the larger number of samples included in the average

Better representation of the targeted region, especially at far distances where a large sector size could envelop a vast areaSlide12

SSvsDD Campaign IntroductionLocation:

Danish National Test Centre for Large Wind Turbines (Høvsøre)Period: 30 April – 7 May, 2014Purpose:To test dual Doppler and sector scan performanceSlide13

Høvsøre Site Overview5 turbine test stands

6 meteorological mastsSimple, flat terrain (-1, 3m) elevationWesterly winds from the North SeaSlide14

Experimental Design3 WindScanners deployed

1x 60 degree sector scan2x static dual DopplerAll beams intersect atop 116.5m met-mastCup anemometer at 116.5mWind vane and sonic at 100mCalibration and deployment procedures outlined in written thesisSlide15

Methodology

Load raw data

Apply offsets

Filtering

CNR, radial speed

Partial scans

Low availability of scans in 10min period

Wakes (118-270˚ free)

Wind speed (4-25 m/s)

Reduce sector size

Apply iVAP or DD reconstruction

Resample (fast, 1min, 10min)

Compare output between SS, DD, and cup/vaneSlide16

Results: Dual Doppler vs. ReferenceSlide17

Results: 60˚ Sector Scan vs. ReferenceSlide18

Reduction in Sector Size (Animated)

Wind Speed

Wind DirectionSlide19

ConclusionsSSvsDD for commercial purposes1 LiDAR in PPI configuration performs well (wind speed, 99.8% accuracy)

but with more scatterWind direction result is nearly identical, horizontal homogeneity is more applicable than wind speedIs the improvement using dual Doppler worth the added cost?Optimum sector size60 degrees does not perform noticeably better than 30-38 degree sector size!We can now divert the saved time to increase distance, sampling rate, LOS density, etc.

RUNE experiment will apply this resultSlide20

Tack så mycket!