/
This publication was disseminated on 13 December 2018 at 0800 UTC This publication was disseminated on 13 December 2018 at 0800 UTC

This publication was disseminated on 13 December 2018 at 0800 UTC - PDF document

elena
elena . @elena
Follow
344 views
Uploaded On 2021-06-08

This publication was disseminated on 13 December 2018 at 0800 UTC - PPT Presentation

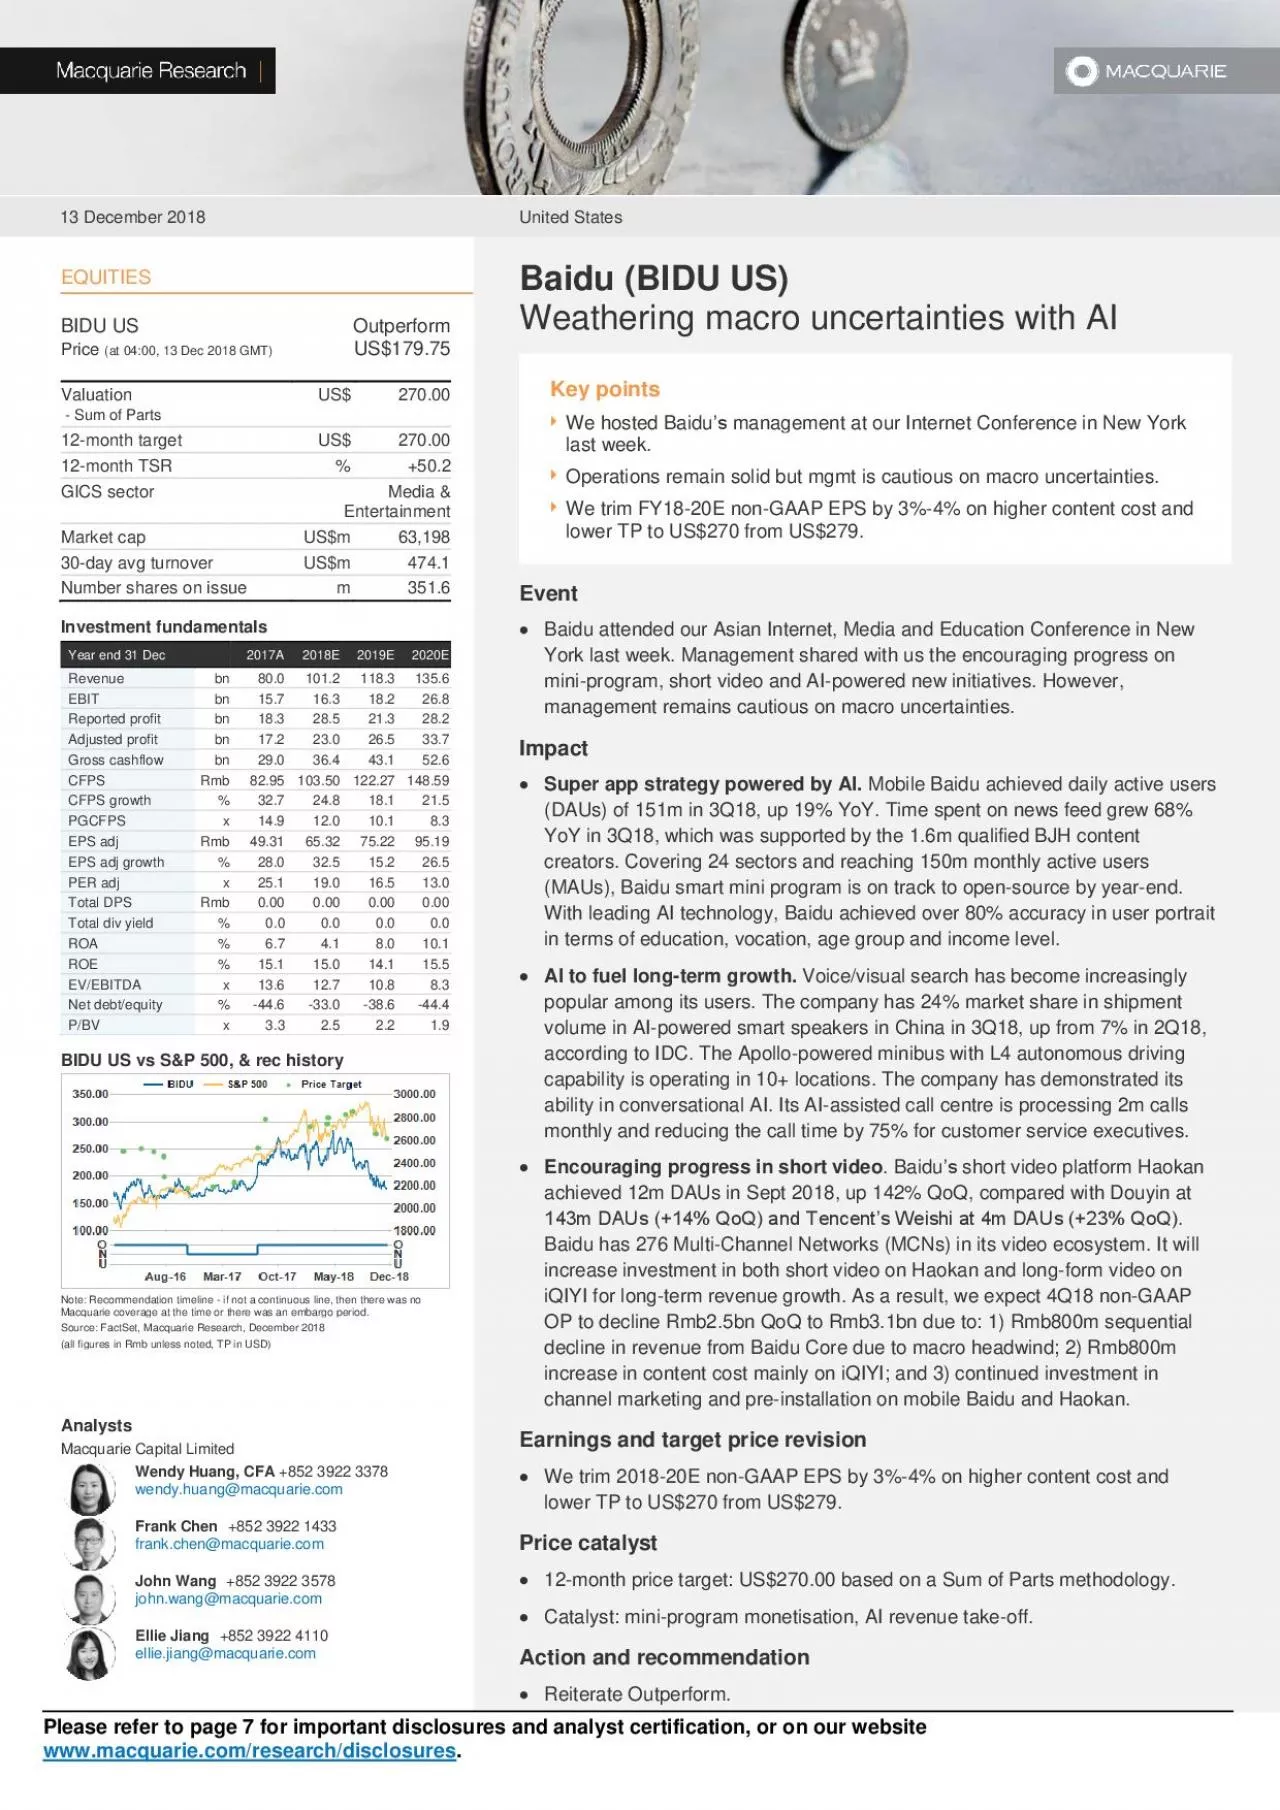
Macquarie Research Baidu BIDU US 13 December 2018 2 Fig 1 Estimates revisions New estimates RMB mn 4Q18E 2018E 2019E 2020E Net revenue 26119 101201 118254 135551 Gross profit 11588 50690 58 ID: 837894

research macquarie securities bps macquarie research bps securities capital net bidu australia gaap return 2018 china 852 3922 profit

Share:

Link:

Embed:

Download Presentation from below link

Download Pdf The PPT/PDF document "This publication was disseminated on 13 ..." is the property of its rightful owner. Permission is granted to download and print the materials on this web site for personal, non-commercial use only, and to display it on your personal computer provided you do not modify the materials and that you retain all copyright notices contained in the materials. By downloading content from our website, you accept the terms of this agreement.


Presentation Transcript

1 This publication was disseminated on 13
This publication was disseminated on 13 December 2018 at 08:00 UTC. Macquarie Research Baidu (BIDU US) 13 December 2018 2 Fig 1 Estimates revisions New estimates (RMB mn) 4Q18E 2018E 2019E 2020E Net revenue 26,119 101,201 118,254 135,551 Gross profit 11,588 50,690 58,505 71,912 Operating profit 1,863 16,281 18,173 26,811 GAAP OPM 7.1% 16.1% 15.4% 19.8% Non - GAAP Operating profit 3,122 20,674 23,409 32,367 Non - GAAP GAAP OPM 12.0% 20.4% 19.8% 23.9% Non - GAAP net profit 4,299 23,002 26,544 33,721 Non - GAAP diluted EPS (RMB) 12.2 65.3 75.2 95.2 Old estimates (RMB mn) 4Q18E 2018E 2019E 2020E Net revenue 26,119 101,201 118,254 135,551 Gross profit 12,368 51,470 59,725 73,232 Operating profit 2,643 17,061 19,393 28,131 GAAP OPM 10.1% 16.9% 16.4% 20.8% Non - GAAP Operating profit 3,902 21,454 24,629 33,687 Non - GAAP GAAP OPM 14.9% 21.2% 20.8% 24.9% Non - GAAP net profit 4,977 23,680 27,630 35,093 Non - GAAP diluted EPS (RMB) 14.1 67.3 78.3 99.1 Revision Changes 4Q18E 2018E 2019E 2020E Net revenue 0.0% 0.0% 0.0% 0.0% Gross profit - 6.3% - 1.5% - 2.0% - 1.8% Operating profit - 29.5% - 4.6% - 6.3% - 4.7% Non - GAAP Operating profit - 20.0% - 3.6% - 5.0% - 3.9% Non - GAAP net profit - 13.6% - 2.9% - 3.9% - 3.9% Non - GAAP diluted EPS (RMB) - 13.6% - 2.9% - 3.9% - 3.9% Source: Company data, Macquarie Research, December 2018 Fig 2 Key assumptions Key a ssumptions 2015A 2016A 2017A 2018E 2019E 2020E Net revenue RMB mn 62,664 66,599 80,043 101,201 118,254 135,551 YoY 35% 6% 20% 26% 17% 15% Search revenue RMB mn 54,520 55,990 63,638 76,602 82,045 87,420 YoY 35% 3% 14% 20% 7% 7% % of total revenue 87% 84% 80% 76% 69% 64% Desktop search RMB mn 25,561 19,642 13,810 12,778 12,352 11,692 YoY - 5% - 23% - 30% - 7% - 3% - 5% % of total revenue 41% 29% 17% 13% 10% 9% Mobile search RMB mn 27,468 34,912 48,300 63,824 69,694 75,728 YoY 103% 27% 38% 32% 9% 9% % of total revenue 44% 52% 60% 63% 59% 56% Video revenue RMB mn 5,021 10,608 16,405 24,599 32,146 39,516 YoY 23% 111% 55% 50% 31% 23% % of total revenue 8% 16% 20% 24% 27% 29% No. of advertisers ('000) 573 539 467 500 521 539 ARPU per annum RMB 105,499 112,956 147,939 164,050 186,625 208,580 TAC ratio - 14.1% - 15.6% - 12.1% - 10.9% - 10.9% - 10.7% Source: Company data, Macquarie Research, December 2018 Macquarie Research Baidu (BIDU US) 13 December 2018 3 Fig 3 SOTP valuation (new) 2019E non - GAAP net profit / loss (Rmb mn) 2019 net revenue (Rmb mn) Multiple Fair value (US$ bn) Baidu Stake Contribution to Baidu(US$bn) Fair value per share (US$) Search 31,841 82,045 15x FY19 PE 69.0 100% 69.0 196 iQIYI 32,146 3x FY19 EV/sales 13.9 59% 8.2 23 Didi 50.0 3% 1.5 4 Ctrip 27x FY19 PE 27.0 19% 5.2 15 Net Cash as of 2019 11.5 100% 11.5 33 Total 95 270 Source: Company data, Macquarie Research, December 2018 Fig 4 SOTP valuation (old) 2019E non - GAAP net profit / loss (Rmb mn) 2019 net revenue (Rmb mn) Multiple Fair value (US$ bn) Baidu Stake Contribution to Baidu(US$bn) Fair value per share (US$) Search 32,700 82,045 15x FY19 PE 70.9 100% 70.9 201 iQIYI 32,146 3x FY19 EV/sales 13.9 59% 8.2 23 Didi 50.0 3% 1.5 4 Ctrip 27x FY19 PE 32.6 19% 6.3 18 Net Cash as of 2019 11.8 100% 11.8 33 Total 99 2 79 Source: Company data, Macquarie Research, November 2018 Macquarie Research Baidu (BIDU US) 13 December 2018 4 Fig 5 Ratios YE 31 December 2015 2016 2017 2018E 2019E 2020E 17 - 18E 18E - 19E 19E - 22E Per ADR EPADS, basic (USD) 14.88 4.83 8.10 11.81 8.79 11.57 46% - 26% 26% EPADS, diluted (USD) 14.83 4.82 8.05 11.71 8.72 11.49 45% - 25% 26% EPADS, non - GAAP diluted (USD) 5.81 3.98 7.45 9.36 10.62 13.51 26% 13% 24% EPADS, non - GAAP diluted (CNY) 100.04 33.37 49.33 65.33 75.23 95.20 32% 15% 23% DPADS, diluted (USD) 0.00 0.00 0.00 0.00 0.00 0.00 -- -- -- BVADS, d

2 iluted (USD) 37.09 40.51 57.3
iluted (USD) 37.09 40.51 57.33 72.42 82.31 94.91 26% 14% 16% Net cash per ADR (USD) 14.54 20.46 25.14 24.15 32.60 43.56 - 4% 35% 32% Avg. ADR, basic (mn) 349.2 346.6 347.2 349.0 350.1 351.5 1% 0% 0% Avg. ADR, diluted (mn) 350.4 347.5 349.5 352.1 352.8 354.2 1% 0% 0% Value EV/Revenue X 5.7 x 5.7 x 4.5 x 3.7 x 3.2 x 2.8 x -- -- -- EV/EBITDA X 20.2 x 20.7 x 13.0 x 12.8 x 10.9 x 8.3 x -- -- -- EV/FCF X - 111.1 x - 34.3 x - 8.4 x 112.1 x 30.5 x 20.0 x -- -- -- Price/ Sales X 6.5 x 6.6 x 5.1 x 4.3 x 3.7 x 3.2 x -- -- -- Price/ Book X 4.8 x 4.4 x 3.1 x 2.5 x 2.2 x 1.9 x -- -- -- P/E (basic) X 12.1 x 37.2 x 22.2 x 15.2 x 20.4 x 15.5 x -- -- -- Non - GAAP P/E (diluted) X 30.9 x 45.2 x 24.1 x 19.2 x 16.9 x 13.3 x -- -- -- P/E (diluted, non - GAAP) ex - cash X 28.4 x 40.0 x 20.8 x 16.6 x 13.9 x 10.1 x -- -- -- Profit & loss Net revenue (USD mn) 9,670 9,592 12,302 14,620 17,084 19,583 19% 17% 11% EBITDA (USD mn) 2,706 2,647 4,217 4,294 5,023 6,606 2% 17% 21% EBIT (USD mn) 1,801 1,447 2,411 2,352 2,625 3,873 - 2% 12% 30% Non - GAAP Operating profit (USD mn) 2,015 1,701 2,910 2,987 3,382 4,676 3% 13% 25% Pretax profit (USD mn) 5,850 2,090 3,271 4,160 3,224 4,597 27% - 23% 30% Net income (USD mn) 5,195 1,675 2,813 4,122 3,078 4,069 47% - 25% 27% Non - GAAP Net Income (USD mn) 5,409 1,670 2,650 3,323 3,835 4,872 25% 15% 23% Profitability Gross margin % 62% 53% 52% 50% 49% 53% (230 bps) (61 bps) 698 bps EBITDA margin % 28% 28% 34% 29% 29% 34% (491 bps) 3 bps 847 bps Operating margin % 19% 15% 20% 16% 15% 20% (351 bps) (72 bps) 880 bps Non - GAAP OPM % 21% 18% 24% 20% 20% 24% (323 bps) (63 bps) 849 bps Net margin % 54% 17% 23% 28% 18% 21% 533 bps (1017 bps) 837 bps Non - GAAP net margin % 56% 17% 22% 23% 22% 25% 119 bps (28 bps) 806 bps Cash Flow Operating Cash Flow (USD mn) 2,997 3,206 5,054 7,471 6,412 7,550 48% - 14% 16% Free Cash Flow (USD mn) - 493 - 1,598 - 6,519 489 1,796 2,733 - 107% 267% 32% +EBIT*(1 - t) (USD mn) 1,541 1,157 2,072 1,973 2,225 3,282 - 5% 13% 30% +D&A (USD mn) 904 1,199 1,806 1,942 2,397 2,732 8% 23% 11% +Capex & Investments (USD mn) - 3,678 - 5,382 - 10,798 - 4,833 - 3,763 - 4,031 - 55% - 22% 6% +Change in NWC (USD mn) 740 1,428 401 1,408 936 749 251% - 33% - 16% Yield Dividend yield % 0.0% 0.0% 0.0% 0.0% 0.0% 0.0% 0 bps 0 bps 0 bps FCF yield % - 0.8% - 2.6% - 10.4% 0.8% 2.8% 4.3% 1115 bps 206 bps 363 bps Earnings yield % 8.3% 2.7% 4.5% 6.6% 4.9% 6.4% 206 bps (168 bps) 492 bps Balance sheet Net debt (cash) (USD mn) - 5,094 - 7,111 - 8,785 - 8,502 - 11,502 - 15,430 - 3% 35% 32% Net debt/ equity (USD mn) cash cash cash cash cash cash -- -- -- Shareholders' equity (USD mn) 12,996 14,078 20,038 25,499 29,041 33,620 27% 14% 17% Efficiency ROE (average) % 48.5% 12.8% 16% 19% 11% 13% 255 bps (731 bps) 330 bps ROA (average) % 27% 7% 8% 11% 7% 9% 232 bps (344 bps) 339 bps ROIC (average) % 11% 8% 10% 8% 8% 11% (199 bps) (45 bps) 432 bps Source: Company data, Macquarie Research, December 2018 Macquarie Research Baidu (BIDU US) 13 December 2018 5 Fig 6 Financials Year - en ding Dec 31 2015 2016 2017 2018E 2019E 2020E 17 - 18E 18E - 19E 19E - 22E Consolidated income statement (RMB mn) Net revenue 62,664 66,599 80,043 101,201 118,254 135,551 26% 17% 11% Cost of services - 22,764 - 30,457 - 36,698 - 50,511 - 59,749 - 63,639 38% 18% 6% Gross profit 39,900 36,141 43,345 50,690 58,505 71,912 17% 15% 16% GP margin 64% 54% 54% 50% 49% 53% (406 bps) (61 bps) 698 bps SG&A (inc.SBC) - 27,302 - 25,325 - 26,241 - 34,409 - 40,332 - 45,102 31% 17% 9% Operating profit 12,599 10,817 17,103 16,281 18,173 26,811 - 5% 12% 30% OP margin 20% 16% 21% 16% 15% 20% (528 bps) (72 bps) 880 bps Pre - tax income 37,907 14,509 21,282 28,798 22,314 31,823 35% - 23% 30% Income taxe

3 s (Credit) - 5,474 - 2,914 - 2,995
s (Credit) - 5,474 - 2,914 - 2,995 - 4,644 - 3,406 - 4,858 55% - 27% 30% Net income 33,664 11,632 18,300 28,532 21,308 28,165 56% - 25% 27% Non - GAAP net income 35,051 11,597 17,243 23,002 26,544 33,721 33% 15% 23% EBITDA 18,459 19,144 28,851 29,720 34,767 45,725 3% 17% 21% EBITDA margin 29% 29% 36% 29% 29% 34% (668 bps) 3 bps 847 bps Consolidated balance sheet (RMB mn) Current assets 78,234 99,759 151,169 142,238 160,431 187,186 - 6% 13% 19% Cash and Short - term investment 68,025 90,159 100,717 106,161 120,007 142,006 5% 13% 21% Cash and cash equivalents 9,960 10,898 11,084 15,871 25,203 42,463 43% 59% 60% Restricted cash 96 318 252 15 15 15 - 94% 0% 0% Short - term investment 57,969 78,943 89,381 90,275 94,789 99,528 1% 5% 5% Loans and interest receivable 227 1,800 23,938 0 0 0 - 100% -- -- Receivables 3,927 4,109 4,571 6,057 7,401 8,855 32% 22% 16% Other current assets 6,054 3,690 21,943 30,021 33,023 36,325 37% 10% 10% Fixed assets 69,620 82,239 100,559 136,434 142,883 148,567 36% 5% 3% PP&E 10,627 11,294 12,475 17,076 21,792 26,610 37% 28% 18% Intangible assets (net) 3,335 3,872 5,467 8,933 10,666 11,533 63% 19% 5% Goodwill 15,396 15,342 15,806 17,051 17,051 17,051 8% 0% 0% Lon g - term investments 37,959 45,690 56,283 80,589 80,589 80,589 43% 0% 0% Loans and interest receivable 122 2,709 3,467 0 0 0 - 100% -- -- Other fixed assets 2,182 3,331 7,061 12,785 12,785 12,785 81% 0% 0% Total assets 147,853 181,997 251,728 278,673 303,313 335,754 11% 9% 12% Current liabilities 26,103 46,102 82,057 55,096 62,922 69,560 - 33% 14% 8% Accounts payable 17,636 21,630 27,523 36,090 42,302 47,305 31% 17% 9% Customer deposit 5,420 6,032 6,785 8,579 10,024 11,490 26% 17% 11% Deferred rev 376 596 788 996 1,164 1,334 26% 17% 11% ST Loan 1,075 6,318 7,744 8,039 8,039 8,039 4% 0% 0% Amounts due to the third - party investor 7,025 38,486 0 0 0 - 100% -- -- Other current liabilities 1,596 4,501 731 1,392 1,392 1,392 90% 0% 0% LT loan 33,942 34,471 35,812 39,273 32,351 27,160 -- -- - 14% Other LT liabilities 3,593 3,682 3,487 7,801 7,021 6,319 -- -- - 10% LT liabilities 37,535 38,153 39,299 47,074 39,372 33,478 20% - 16% - 13% Total liabilities 63,638 84,255 121,356 102,170 102,294 103,039 - 16% 0% 1% Shareholders' equity 84,216 97,742 130,372 176,503 201,020 232,715 35% 14% 17% Capital 6,402 8,323 12,088 32,090 35,299 38,829 165% 10% 10% Retained earnings 74,659 85,734 102,328 130,860 152,168 180,333 28% 16% 19% Other 3,154 3,686 15,956 13,553 13,553 13,553 - 15% 0% 0% Total Sh. equity + liabilities 147,853 181,997 251,728 278,673 303,313 335,754 11% 9% 12% Consolidated cash flow (RMB mn) Operating cash flow 19,422 22,258 32,880 51,716 44,383 52,264 57% - 14% 16% Net income 33,664 11,632 18,300 28,532 21,308 28,165 56% - 25% 27% Depreciation & amortization 5,861 8,328 11,748 13,440 16,594 18,914 14% 23% 11% Change in net working capital 4,793 9,913 2,606 9,744 6,481 5,185 274% - 33% - 16% Other - 24,896 - 7,615 226 0 0 0 -- -- -- Investing cash flow - 23,835 - 37,369 - 70,252 - 33,455 - 26,044 - 27,901 - 52% - 22% 6% Capex - 5,230 - 4,189 - 4,779 - 9,108 - 10,643 - 12,200 91% 17% 11% Purchase of intangible assets - 2,735 - 5,414 - 9,538 - 12,399 - 12,399 - 12,399 -- -- 0% Other investments - 15,870 - 27,766 - 55,936 - 11,948 - 3,002 - 3,302 - 79% - 75% 10% Financing cash flow 14,175 37,245 47,930 - 12,817 - 4,493 - 2,364 - 127% - 65% - 17% Capital 2,711 2,452 16,035 17,599 3,209 3,530 -- -- 10% Others 28,931 - 2,138 Dividends 0 0 0 0 0 0 -- -- -- Debt increase (decrease) 11,464 5,861 34,033 - 30,416 - 7,702 - 5,894 -- -- - 4% Effect of foreign exchange rate changes 179 0 0 0 0 0 -- -- -- Net change in cash 9,941 22,134 10,558 5,444 13,846 21,999 - 48% 154% 37% Cash at beginning of period 58,084 68,025 90,159 100,717 106,161 120,007 12% 5% 18% Cash at end of period 68,025 90,159 100,717 106,161 120,007 142,006 5% 13% 21% Source: Company data, Macquarie Research

4 , December 2018 Macquarie Resear
, December 2018 Macquarie Research Baidu (BIDU US) 13 December 2018 6 Macquarie Quant Alpha Model View s The Quant View page below has been derived from models that are developed and maintained by Sales and Trading personnel at M acquarie. The models are not a product of the Macquarie Research Department. The quant model currently holds a marginally negative view on Baidu. The strongest style exposure is Growth, indicating this stock has good historic and/or forecast growth. Growth metrics focus on both top and bottom line items. The weakest style exposure is Valuations, indicating this stock is over - priced in the market relative to its peers. Displays where the company’s ranked based on the fundamental consensus Price Target and Macquarie’s Quantitative Alpha model. Two rankings: Local market (China) and Global sector (Telecommunication Services) 363 / 669 Global rank in Telecommunication Services % of BUY recommendations 77 % ( 24 / 31 ) Number of Price Target downgrades 2 Number of Price Target upgrades 0 Macquarie Alpha Model ranking Factors driving the Alpha Model A list of comparable companies and their Macquarie Alpha model score (higher is better). For the comparable firms this chart shows the key underlying styles and their contribution to the current overall Alpha score. Macquarie Earnings Sentiment Indicator Drivers of Stock Return The Macquarie Sentiment Indicator is an enhanced earnings revisions signal that favours analysts who have more timely and higher conviction revisions. Current score shown below . Breakdown of 1 year total return (local currency) into returns from dividends, changes in forward ea rnings estimates and the resulting change in earnings multiple. What drove this Company in the last 5 years How it looks on the Alpha model Which factor score has had the greatest correlation with the company’s returns over the last 5 years . A more granular view of the underlying style scores that drive the alpha (higher is better) and the percentile rank relative to the sector and market. Source (all charts): FactSet, Thomson Reuters, and Macquarie Quant . For more details on the Macquarie Alpha model or for more customised analysis and screens, please contact the Macquarie Global Quantitative/Custom Products Group ( cpg@macquarie.com ) Macquarie Research Baidu (BIDU US) 13 December 2018 7 I mportant disclosures : Recommendation definitions Macquarie - Australia/New Zealand Outperform – return �3% in excess of benchmark return Neutral – return within 3% of benchmark return Underperform – return �3% below benchmark return Benchmark return is determined by long term nominal GDP gro wth plus 12 month forward market dividend yield , which is currently around 9%. Macquarie – Asia/Europe Outperform – expected return �+10% Neutral – expected return from - 10% to +10% Underperform – expected return - 10% Mazi Macquarie – South Africa Outperf orm – expected return �+10% Neutral – expected return from - 10% to +10% Underperform – expected return - 10% Macquarie - Canada Outperform – return �5% in excess of benchmark return Neutral – return within 5% of benchmark return Underperform – return �5% b elow benchmark return Macquarie - USA Outperform (Buy) – return �5% in excess of Russell 3000 index return Neutral (Hold) – return within 5% of Russell 3000 index return Underperform (Sell) – return �5% below Russell 3000 index return Volatility index definition* This is calculated from the volatility of historic al price movements. Very high – highest risk – Stock should be expected to move up or down 60 – 100% in a year – investors should be aware this stock is highly speculative. High – stock should be expected to move up or down at least 40 – 60% in a year – investors should be aware this stock could be speculative. Medium – stock should be expected to move up or down at least 30 – 40% in a year. Low – medium – stock should be expected to move up or down at least 25 – 30% in a year. Low – stock should be expected to move up or down at least 15 – 25% in a year. * Applicable to Asia/Australian/NZ / Canada stocks only Recommendations – 12 months Note: Quant recommendations may differ from Fundamental Analyst recommendations Financial definitions All "Adjusted" data items have had the following adjustments made: Added back: goodwill amortisation, provision for catastrophe reserves, IFRS derivatives & hedging, IFRS impairments & IFRS interest expense Excluded: non recurring items, asset revals, property revals, appraisal value uplift, preference dividends & minority interests

5 EPS = adjusted net profit / efpowa
EPS = adjusted net profit / efpowa* ROA = adjusted ebit / average total asse ts ROA Banks/Insurance = adjusted net profit /average total assets ROE = adjusted net profit / average shareholders funds Gross cashflow = adjusted net profit + depreciation *equivalent fully paid ordinary weighted average number of shares All Reported nu mbers for Australian/NZ listed stocks are modelled under IFRS (International Financial Reporting Standards). Recommendation proportions – For quarter ending 30 September 2018 AU/NZ Asia RSA USA CA EUR Outperform 51.56% 59.51% 45.05% 46.88% 67.86% 46.70% ( for global coverage by Macquarie, 3.70% of stocks followed are investment banking clients ) Neutral 33.20% 28.92% 37.36% 47.70% 25.00% 42.73% ( for global coverage by Macquarie, 2.04% of stocks followed are investment banking clients ) Underperform 15.23% 11.57% 17.58% 5.42% 7.14% 10.57% ( for global coverage by Macquarie, 0.47% of stocks followed are investment banking clients ) BIDU US vs S&P 500, & rec history (all figures in USD currency unless noted) Note: Recommendation timeline – if not a continuous line, then there was no Macquarie coverage at the time or there was an embargo period. Source: FactSet, Macquarie Research, December 2018 12 - month target price methodology BIDU US: US$270.00 based on a Sum of Parts methodology Company - specific disclosures : Important disclosure information regarding the subject companies covered in this report is available at www.macquarie.com/research/disclosures . Date Stock Code (BBG code) Recommendation Target Price 31 - Oct - 2018 BIDU US Outperform US$279.00 01 - Aug - 2018 BIDU US Outperform US$320.00 06 - Jul - 2018 BIDU US Outperform US$314.00 28 - Apr - 2018 BIDU US Outperform US$308.00 24 - Apr - 2018 BIDU US Outperform US$296.00 15 - Feb - 2018 BIDU US Outperform US$291.00 25 - Aug - 2017 BIDU US Outperform US$305.00 29 - Jul - 2017 BIDU US Outperform US$252.00 28 - Apr - 2017 BIDU US Neutral US$189.00 04 - Feb - 2017 BIDU US Neutral US$182.00 29 - Oct - 2016 BIDU US Neutral US$179.00 29 - Jul - 2016 BIDU US Outperform US$199.00 27 - Jul - 2016 BIDU US Outperform US$237.00 16 - Jun - 2016 BIDU US Outperform US$245.00 30 - Apr - 2016 BIDU US Outperform US$251.00 19 - Feb - 2016 BIDU US Outperform US$246.00 Target price risk disclosures : BIDU US: Any inability to compete successfully in their markets may harm the business. This could be a result of many factors which ma y include geographic mix and introduction of improved products or service offerings by competitors. The results of operations may be materially affect ed by global economic conditions generally, including conditions in financial markets. The company is exposed to market risks, such as changes in interest rates, foreign exchange rates and input prices. From time to time, the company will enter into transactions, including transactions in derivative instruments, to manage certain of these exposures. Macquarie Research Baidu (BIDU US) 13 December 2018 8 Analyst certification : We hereby certify that all of the views expressed in this report accurately reflect our personal views about the subject company or companies and its or their securities. We also certify that no part of our compensation was, is or will be, directly or indirec tly, related to the specific recommendations or views expressed in this report. The Analysts responsible for preparing this report receive compensation from Macquarie that is base d upon various factors including Macquarie Group Ltd total revenues, a portio n of which are generated by Macquarie Group’s Investment Banking activities. General disclaimers: Macquarie Securities (Australia) Ltd; Macquarie Capital (Europe) Ltd; Macquarie Capital Markets Canada Ltd; Macquarie Capital Markets North America Ltd; Macquarie Capital (USA) Inc; Macquarie Capital Limite d , Taiwan Securities Branch; Macquarie Capital Securities (Singapore) Pte Ltd; Macquarie Securities (NZ) Ltd; Mazi Macquarie Securities (RF) (Pty) Ltd ; Macquarie Capital Securities (India) Pvt Ltd; Macqu arie Capital Securities (Malaysia) Sdn Bhd; Macquarie Securities Korea Limited and Macquarie Securities (Thailand) Ltd are not authorized deposit - taking institutions for the purposes of the Banking Act 1959 (Commonwealth of Australia), and their obligation s do not represent deposits or other liabilities of Macquarie Bank Limited ABN 46 008 583 542 (MBL) or MGL. MBL does not guarantee or otherwise provide assurance in respect of the obligations of any of the above mentioned entities. MGL provides a guarant ee to the Monetary Authority of Singapore in respect of the obligations and liabilities of Macquarie Capita

6 l Securities (Singapore) Pte Ltd for up
l Securities (Singapore) Pte Ltd for up to SGD 35 million. This research has been prepared for the general use of the wholesale clients o f the Macqu arie Group and must not be copied, either in whole or in part, or distributed to any other person. If you are not the intended recipient you must not use or disclose the information in this research in any way. If you received it in error, please tell us i mmediately by return e - mail and delete the document. We do not guarantee the integrity of any e - mails or attached files and are not responsible for any changes made to them by any other person. MGL has established and implemented a conflicts policy at grou p level (which may be revised and updated from time to time) (the "Conflicts Policy") pursuant to regulatory requirements (including the FCA Rules) which sets out how we must seek to identify and manage all material conflic ts of interest. Nothing in this r esearch shall be construed as a solicitation to buy or sell any security or product, or to engage in or refrain from engaging in any transaction. In preparing this research, we did not take into account your investment objectives, financial situation or pa rticular needs. Macquarie salespeople, traders and other professionals may provide oral or written market commentary or trading strategies to our clients that reflect opini ons which are contrary to the opinions expressed in this research. Macquarie Researc h produces a variety of research products including, but not limited to, fundamental analysis, macro - economic analysis, quantitative analysis, and trade ideas. Recommendations contained in one type of research product may diff er from recommendations contai ned in other types of research, whether as a result of differing time horizons, methodologies, or otherwise. Before making an investment decision on the basis of this research, you need to consider, with or without the assistance of an adviser, whethe r the advice is appropriate in light of your particular investment needs, objectives and financial circumstances. There are risks involved in securities trading. The price of securities can and does fluctuate, and an individual security may even become valueles s. International investors are reminded of the additional risks inherent in international investments, such as currency fluctuations and international stock market or economic conditions, which may adv ersely affect the value of the investment. This researc h is based on information obtained from sources believed to be reliable but we do not make any representation or warranty that it is accurate, complete or up to date. We accept no obligation to correct or update the information or opinions in it. Opinions expressed are subject to change without notice. No member of the Macquarie Group accepts any liability whatsoever for any direct, indirect, consequ ential or other loss arising from any use of this research and/or further communication in relation to this r esearch. Clients should contact analysts at, and execute transactions through, a Macquarie Group entity in their home jurisdiction unless governing law permits otherwise. The date and timestamp f or above share price and market cap is the closed price of t he price date. #CLOSE is the final price at which the security is traded in the relevant exchange on the date indicated. Members of the Macro Strategy team are Sales & Trading personnel who provide desk commentary that is not a product of the Mac quarie Res earch department or subject to FINRA Rule 2241 or any other regulation regarding independence in the provision of equity research. Country - specific disclaimers: Australia : In Australia, research is issued and distributed by Macquarie Securities (Australia ) Ltd (AFSL No. 238947), a participating organization of the Australian Securities Exchange. Macquarie Securities (Australia) Limited staff involved with the preparation of research have regular interaction with companies they cover. Additionally, Macquari e Group Limited does and seeks to do business with companies covered by Macquarie Research. There are robust information barriers in place to protect the independence of Macquarie Research’s product. However, recipients of Macquarie Research should be awar e of this potential conflict of interest. New Zealand : In New Zealand, research is issued and distributed by Macquarie Securities (NZ) Ltd, a NZX Firm. Canada : In Canada, research is prepared, approved and distributed by Macquarie Capital Markets Canada Lt d., a (i) member of the Investment Industry Regulatory Organization of Canada and the Canadian Investor Protection Fund, and (ii) participating organ isation of the Toronto Stock Exchange, TSX Venture Exchange & Montréal Exchange. This research is distribut ed in the United States, as third party research by Macquarie Capital Markets North America Ltd., which is a registered broker - dealer and member of Financial Industry Regulatory Authority and the Securities Inve

7 stor Protection Corporation. Macquarie C
stor Protection Corporation. Macquarie Capita l Markets North America Ltd. accepts responsibility for the contents of reports issued by Macquarie Capital Markets Canada Ltd. in the United States and sent to US persons. Any US person wishing to effect transactions in the securities described in the rep orts issued by Macquarie Capital Markets Canada Ltd. should do so with Macquarie Capital Markets North America Ltd. This rese arch is intended for distribution in the United States only to major Institutional Investors (as such term is defined in SEC 15a - 6 and Section 15 of the Securities Exchange Act of 1934, as amended) and is not intended for the use of any person or entity that is not a major institutional i nvestor. Research analysts of Macquarie Capital Markets Canada Ltd. are not registered/qualified as research analysts with FINRA. The Research Distribution Policy of Macquarie Capital Markets Canada Ltd. is to allow all clients that are entitled to have equal access to our research. United Kingdom : In the United Kingdom, research is issued and distri buted by Macquarie Capital (Europe) Ltd, which is authorised and regulated by the Financial Conduct Authority (No. 193905). Germany : In Germany, this research is issued and/or distributed by Macquarie Capital (Europe) Limited, Niederlassung Deutschland, wh ich is authorised and regulated by the UK Financial Conduct Authority (No. 193905). and in Germany by BaFin. France : In France, research is issued and distributed by Macquarie Capital (Europe) Ltd, which is authorised and regulated in the United Kingdom by the Financial Conduct Authority (No. 193905). Hong Kong & Mainland China : In Hong Kong, research is issued and distributed by Macquarie Capital Limited, which is licensed and regulated by the Securities and Futures Commission. In Mainland China, Macquarie Securities (Australia) Limited Shanghai Representative Office only engages in non - business operational activities excluding issuing and distributing research. Only non - A share research is distributed into Mainland China by Macquarie Capital Limited. Japa n : In Japan, research is Issued and distributed by Macquarie Capital Securities (Japan) Limited, a member of the Tokyo Stock Exchange, Inc. and Osaka Exchange, Inc. (Financial Instruments Firm, Kanto Financial Bureau (kin - sho) No. 231, a member of Japan Se curities Dealers Association). India : In India, research is issued and distributed by Macquarie Capital Securities (India) Pvt. Ltd. (CIN: U65920MH1995PTC090696), 92, Level 9, 2 North Avenue, Maker Maxity, Bandra Kurla Complex, Bandra (East), Mumbai – 400 051, India, which is a SEBI registered Research Analyst having registration no. INH000000545. Malaysia : In Malaysia, research is issued and distributed by Macquarie Capital Securities (Malaysia) Sdn. Bhd. (Company registration number: 463469 - W) which is a Participating Organisation of Bursa Malaysia Berhad and a holder of Capital Markets Services License issued by the Securities Commission. Taiwan : In Taiwan, research is issued and distributed by Macquarie Capital Limited, Taiwan Securities Branch, which is licensed and regulated by the Financial Supervisory Commission. No portion of the report may be reproduced or quoted by the press or any other person without authorisation from Macquarie . Nothing in this research shall be construed as a solicitation to buy or sell any security or product. The recipient of this report shall not engage in any activities which may give rise t o potential conflicts of interest to the report . Research Associate(s) in this report who are registered as Clerks only assist in t he preparation of research and are not engaged in writing the research. Macquarie may be in past one year or now being an Issuer of Structured Warrants on securities mentioned in this report . Thailand : In Thailand, research is produced, issued and distributed by Macquarie Securities (Thailand) Ltd. Macquarie Securities (Thailand) Ltd. is a licensed securities company that is authorized by the Ministry of Finance, regulated by the Securities and Exchange Commission of Thai land and is an exchange memb er of the Stock Exchange of Thailand. The Thai Institute of Directors Association has disclosed the Corporate Governance Repo rt of Thai Listed Companies made pursuant to the policy of the Securities and Exchange Commission of Thailand. Macquarie Securities (Thailand) Ltd does not endorse the result of the Corporate Governance Report of Thai Listed Companies but this Report can be accessed at: http://www.thai - iod.com/en/publications.asp?type= 4 . South Korea : In South Korea, unless otherwise stated, research is prepared, issued and distributed by Macquarie Securities Korea Limited, which is regulated by the Financial Supervisory Services. Information on analysts in MSKL is disclo sed at http://dis.kofia.or.kr/websquare/index.jsp?w2xPath=/wq/fundMgr/DISFundMgrAnalystStut.xml&divisionId=MDIS 03002001000000&servic

8 eId=SDIS03002 001000 . South Africa : I
eId=SDIS03002 001000 . South Africa : In South Africa, research is issued and distributed by Mazi Macquarie Securities (RF) (Pty) Ltd , a member of the JSE Limited. Singapore : In Singapore, research is issued and distributed by Macquarie Capital Securities (Singapore) Pte Ltd (Company Registration Number: 198702912C), a Capital Markets Services license holder under the Securities and Futures Act to deal in securities and provide custodial services in Macquarie Research Baidu (BIDU US) 13 December 2018 9 Singapore. Pursuant to the Financial Ad visers (Amendment) Regulations 2005, Macquarie Capital Securities (Singapore) Pte Ltd is exempt from complying with sections 25, 27 and 36 of the Financial Advisers Act. All Singapore - based recipients of research produced by Macquarie Capital (Europe) Limi ted, Macquarie Capital Markets Canada Ltd, Mazi Macquarie Securities (RF) (Pty) Ltd and Macquarie Capital (USA) Inc. represent and warrant that they are institutional investors as defined in the Securities and Futures Act. United States : In the United Stat es, research is issued and distributed by Macquarie Capital (USA) Inc., which is a registered broker - dealer and member of FINRA. Macquarie Capital (USA) Inc, accepts responsibility for the content of each research report prepared by one of its non - US affi liates when the research report is distributed in the United States by Macquarie Capital (USA) Inc. Macquarie Capital (USA) Inc.’s affiliate’s analysts are not registered as research analysts w ith FINRA, may not be associated persons of Macquarie Capital ( USA) Inc., and therefore may not be subject to FINRA rule restrictions on communications with a subject company, public appearances, and trading securities held by a research analyst account. Information regarding futures is prov ided for reference purposes only and is not a solicitation for purchases or sales of futures. Any persons receiving this report directly from Macquarie C apital (USA) Inc. and wishing to effect a transaction in any security described herein should do so with Macquarie Capital (USA) I nc. Important disclosure information regarding the subject companies covered in this report is available at www.macquarie.com/research/disclosures , or contact your registered representative at 1 - 888 - MAC - STOCK, or write to the Supervisory Analysts, Research Department, Macquarie Securities, 125 W.55th Street, New York, NY 10019. © Macquarie Group Equities Asia Research Head of Equity Research Jake Lynch (Asia Head) (852) 3922 3583 Ian Myles ( Acting, Australia & NZ) (612) 8232 4157 Hiroyuki Sakaida (Japan Head) (813) 3512 6695 Conrad Werner (ASEAN Head) (65) 6601 0182 Automobiles, Auto Parts Janet Lewis (China, Japan) (813) 3512 7856 James Hong (Korea) (822) 3705 8661 Amit Mishra (India) (9122) 6720 4084 Financials Scott Russell (Asia) (852) 3922 3567 Andrew Buncombe (Australia) (612) 8232 0629 Brendan Carrig (Australia) (612) 8237 6043 Victor German (Australia) (612) 8232 6089 Dexter Hsu (China, Taiwan) (8862) 2734 7530 Keisuke Moriyama (Japan) (813) 3512 7476 Chan Hwang (Korea) (822) 3705 8643 Suresh Ganapathy (Indi a) (9122) 6720 4078 Jayden Vantarakis (Indonesia) (6221) 2598 8310 Anand Pathmakanthan (Malaysia) (603) 2059 8833 Gilbert Lopez (Philippines) (632) 857 0892 Peach Patharavanakul (Thailand) (662) 694 7753 Conglomerates David Ng (China, Hong Kong) (852) 3922 1291 Gilbert Lopez (Philippines) (632) 857 0892 Conrad Werner (Singapore) (65) 6601 0182 Consumer, Gaming Linda Huang (Asia) (852) 3922 4068 Rob Freeman (Australia) (612) 8237 1152 David Fabris (Australia) (612) 8232 5705 Terence Chang (China, Hong Kong) (852) 3922 3581 Leon Rapp (Japan) (813) 3512 7879 Kwang Cho (Korea) (822) 3705 4953 Amit Sinha (India) (9122) 6720 4085 Denise Soon (Malaysia) (603) 2059 8845 Karisa Magpayo (Philippines) (632) 857 0899 Chalinee Congmuang (Thailand) (662) 694 7993 Emergin g Leaders Jake Lynch (Asia) (852) 3922 3583 Tim Lawson (Australia) (612) 8237 7332 Kwang Cho (Korea) (822) 3705 4953 Corinne Jian (Greater China) (8862) 2734 7522 Conrad Werner (ASEAN) (65) 6601 0182 Infrastructure, Industrials, Transportation Ian Myles (Australia) (612) 8232 4157 John Purtell (Australia) (612) 8232 8633 David Fabris (Australia) (612) 8232 5705 Peter Steyn (Australia) (612) 8232 5144 Patrick Dai (China) (8621) 2412 9082 Eric Zong (China, Hong Kong) (852) 3922 4749 Kunio Sakaida (Japan) (8 13) 3512 7873 Infrastructure, Industrials, Transportation - Cont. James Hong (Korea) (822) 3705 8661 Corinne Jian (Taiwan) (8862) 2734 7522 Inderjeetsingh Bhatia (India) (9122) 6720 4087 Internet, Media and Software Wendy Huang (Asia) (852) 3922 3378 John Wang (China, Hong Kong) ( 852 ) 3922 3578 Ellie Jiang (China, Hong Kong)

9 ( 852 ) 3922 4110 Frank Chen (Chin
( 852 ) 3922 4110 Frank Chen (China, Hong Kong) ( 852 ) 3922 1433 Andy Kim (Korea) (822) 3705 8690 Alankar Garude (India) (9122) 6720 4134 Oil, Gas and Petrochemicals Aditya Suresh (Asia) (852) 3922 1265 Anna Park ( Asia ) (822) 3705 8669 Andrew Hodge (Australia) (612) 8237 0321 Yasuhiro Nakada (Japan) (813) 3512 7862 Corinne Jian (Taiwan) (8862) 2734 7522 Ben Shane Lim (Malaysia) (603) 2059 8868 Yupapan Polpornprasert (Thailand) (662) 694 7729 Pharmaceuticals and Healthcare David Bailey (612) 8237 2427 David Ng (China, Hong Kong) (852) 3922 1291 Xiang Gao (China, Hong Kong) (8621) 2412 9006 Corinne Jian ( China ) (8862) 2734 7522 Mi H yun Kim (Korea) (822) 3705 8689 Alankar Garude (India) (9122) 6720 4134 Property, REIT Rob Freeman (Australia) (612) 8237 1152 Stuart McLean (Australia) (612) 8232 2859 Darren Leung (Australia) (612) 8232 8544 David Ng (China, Hong Kong) (852) 3922 1291 Kelvin Tam (China) (852) 3922 1181 Keisuke Moriyama (Japan) (813) 3512 7476 Derrick Heng (Singapore) (65) 6601 0436 Abhishek Bhandari (India) (9122) 6720 4088 Aiman Mohamad (Malaysia) (603) 2059 8986 Kervin Sisayan (Philippines) (632) 857 0893 Richard Danusaputra (Indonesia) (6221) 2598 8368 Bo Denworalak (Thailand) (662) 694 7774 Materials Hayden Bairstow (Australia) (618) 9224 0838 John Purtell (Australia) (612) 8232 8633 David Ching (China, Hong Kong) (852) 3922 1823 Harunobu Goroh (Japan) (813) 3512 7886 Yasuhiro Nakada (Japan) (813) 3512 7862 Anna Park (Korea) (822) 3705 8669 Sumangal Nevatia (India) (9122) 6720 4093 Jayden Vantarakis (Indonesia) (6221) 2598 83 10 Farrah Aqlima (Malaysia) (603) 2059 8987 Technology Damian Thong (Asia, Japan) (813) 3512 7877 Allen Chang (Greater China) (852) 3922 1136 Jeffrey Ohlweiler (Greater China) (8862) 2734 7512 Patrick Liao (Greater China) (8862) 2734 7515 Daniel Kim (Korea) (822) 3705 8641 Abhishek Bhandari (India) (9122) 6720 4088 Farrah Aqlima (Malaysia) (603) 2059 8987 Telecoms Andrew Levy (Australia) (612) 8232 5165 Allen Chang (Greater China) (852) 3922 1136 Prem Jearajasingam (ASEAN) (603) 2059 8989 Kervin Sisayan (Philippines) (632) 857 0893 Nathania Nurhalim (Indonesia) (6221) 2598 8365 Utilities, Renewables Ian Myles (Australia) (612) 8232 4157 Hiroyuki Sakaida (Japan) (813) 3512 6695 Patrick Dai (China) (8621) 2412 9082 Inderjeetsingh Bhatia (India) (912 2) 6720 4087 Karisa Magpayo (Philippines) (632) 857 0899 Strategy, Country Viktor Shvets (Asia, Global) (852) 3922 3883 David Ng (China, Hong Kong) (852) 3922 1291 Hiroyuki Sakaida (Japan) (813) 3512 6695 Chan Hwang (Korea) (822) 3705 8643 Jeffrey Ohlweil er (Taiwan) (8862) 2734 7512 Inderjeetsingh Bhatia (India) (9122) 6720 4087 Conrad Werner (ASEAN, Singapore) (65) 6601 0182 Jayden Vantarakis (Indonesia) (6221) 2598 8310 Anand Pathmakanthan (Malaysia) (603) 2059 8833 Gilbert Lopez (Philippines) (632) 857 0892 Peach Patharavanakul (Thailand) (662) 694 7753 Find our research at Macquarie: www.macquarieresearch.com Thomson: www.thomson.com/financial Reuters: www.knowledge.reuters.com Bloomberg: MAC GO Factset: http://www.factset.com/home.aspx CapitalIQ www.capitaliq.com Email macresearch@macquarie.com for access Asia Sales Regional Heads of Sales Miki Edelman (Global) (1 212) 231 6121 Amelia Mehta (Asia) (65) 6601 0211 Alan Chen (Asia) (852) 3922 2019 Thomas Renz (Geneva) (41 22) 818 7712 Sandeep Bhatia (India) (9122) 6720 4101 Tim Huang (Indonesia) (6221) 2598 8303 Tomohiro Takahashi (Japan) (813) 3512 7823 John Jay Lee (Korea) ( 822) 3705 9988 Nik Hadi (Malaysia) (603) 2059 8888 Dave Roberton (New Zealand) (649) 363 1498 Gino C Rojas (Philippines) (632) 857 0861 Paul Colaco (San Francisco) (1 415) 762 5003 Eric Lin (Taiwan) (8862) 2734 7590 Angus Kent (Thailand) (662) 694 7601 Sales Dominic Smith (Desk Head - Asia) (65) 6601 0212 Dan Pittorino (Desk Head - Sydney) (612) 8237 0905 Gavin Maher (Australia) (612) 8232 4151 Kurt Dalton (Australia) (612) 8232 5943 Mike Johnson (612) 8232 4717 (Desk Head - International Sales) Andrew Haigh (Desk Head - London) (44 20) 3037 4843 Anura Logan (Melbourne) (613) 9635 8177 Leighton Patrick (1 212) 231 25 52 (Desk Head - New York) Sales Trading Mark Weekes (Asia) (852) 3922 2084 Tim Shaw (612) 8232 4386 (Head of Sales Trading - Australia) Stanley Dunda (Indonesia) (6221) 515 1555 Suhaida Samsudin (Malaysia) (603) 2059 8888 Andrew Donald (613) 9635 8270 (Desk Head - Melbourne) Chris Reale (New York) (1 212) 231 2616 Marc Rosa (New York) (1 212) 231 2531 Michael Santos (Philippines) ( 632) 857 0813 Justin Morrison (Singapore) (

10 65) 6601 0288 Sam Molina (Sydney) (6
65) 6601 0288 Sam Molina (Sydney) (612) 8232 5935 Brendan Rake (Thailand) ( 662) 694 7707 Mike Keen (UK/Europe) (44 20) 3037 4905 Please refer to page 7 for important disclosures and analyst certification, or on our website www.macquarie.com/research/disclosures . 13 December 2018 United States EQUITIES BIDU US Outperform Price (at 04:00, 13 Dec 2018 GMT ) US$ 179.75 Valuation US$ 270.00 - Sum of Parts 12 - month target US$ 270.00 12 - month TSR % +50.2 GICS sector Media & Entertainment US$m 63,198 30 - day avg turnover US$m 474.1 Number shares on issue m 351.6 Investment fundamentals Year end 31 Dec 2017A 2018E 2019E 2020E Revenue bn 80.0 101.2 118.3 135.6 EBIT bn 15.7 16.3 18.2 26.8 Reported profit bn 18.3 28.5 21.3 28.2 Adjusted profit bn 17.2 23.0 26.5 33.7 Gross cashflow bn 29.0 36.4 43.1 52.6 CFPS Rmb 82.95 103.50 122.27 148.59 CFPS growth % 32.7 24.8 18.1 21.5 PGCFPS x 14.9 12.0 10.1 8.3 EPS adj Rmb 49.31 65.32 75.22 95.19 EPS adj growth % 28.0 32.5 15.2 26.5 PER adj x 25.1 19.0 16.5 13.0 Total DPS Rmb 0.00 0.00 0.00 0.00 Total div yield % 0.0 0.0 0.0 0.0 ROA % 6.7 4.1 8.0 10.1 ROE % 15.1 15.0 14.1 15.5 EV/EBITDA x 13.6 12.7 10.8 8.3 Net debt/equity % - 44.6 - 33.0 - 38.6 - 44.4 P/BV x 3.3 2.5 2.2 1.9 BIDU US vs S&P 500, & rec history Note: Recommendation timeline - if not a continuous line, then there was no Macquarie coverage at the time or there was an embargo period. Source: FactSet, Macquarie Research, December 2018 (all figures in Rmb unless noted, TP in USD) A naly st s Macquarie Capital Limited Wendy Huang , CFA +852 3922 3378 wendy.huang@macquarie.com Frank Chen +852 3922 1433 frank.chen@macquarie.com John Wang +852 3922 3578 john.wang@macquarie.com Ellie Jiang +852 3922 4110 ellie.jiang@macquarie.com Baidu (BIDU US) Weather ing macro uncertainties with AI Key p oints  We hosted Baidu ’s management at our Internet Conference in New York last week.  O perations remain solid but mgmt is cautious on macro uncertainties.  We trim FY18 - 20E non - GAAP EPS by 3 % - 4 % on higher content cost and lower TP to US$ 270 from US$279. Event  Baidu attended our Asian Internet, Media and Education Conference in New York last week. M anagement shared with us the encouraging progress on mini - program, short video and AI - powered new initiatives. However , management remains cautious on macro uncertainties. Impact  Super app strategy powered by AI . Mobile Baidu achieved daily active user s ( DAU s ) of 151 m in 3Q18, up 19% YoY. Time spent on news feed grew 68% YoY in 3Q18 , which was supported by the 1.6 m qualified BJH content c reators . Covering 24 sectors and reaching 150m monthly active users (MAUs), Baidu smart mini program is on track to open - source by year - end. in terms of education, vocation, age group and income level.  AI to fuel long - term growth. V oice / visual search has become increasingly popular among its users. The company has 24 % market share in shipment volume in AI - powered smart speakers in China in 3Q18, up from 7% in 2Q18, according to IDC. The Apollo - powered minibus with L4 autonomous driving capability is operating in 10 + locations. T he company has demonstrated its ability in conversational AI. Its AI - assisted call centre is processing 2m calls monthly and reducing the call time by 75% for customer service executive s .  Encouraging progress in short video . Baidu ’s short video platform Haokan achieved 12m DAUs in Sept 2018, up 142% QoQ , compared with Douyin at 143m DAUs (+14% QoQ) and Tencent’s Weishi at 4m DAUs (+23% QoQ) . Baidu has 276 Multi - Channel Network s (MCNs) in its video ecosystem. It will increase investment in both short video on Haokan and long - form video on iQIYI for long - term revenue growth. As a result, we expect 4 Q18 non - GAAP OP to decline Rmb2.5bn QoQ to Rmb3.1bn due to : 1) Rmb800m sequential decline in revenue from Baidu Core due to macro headwind; 2) Rmb800m increase in content cost mainly on iQIYI ; and 3) co ntinue d invest ment in channel marketing and pre - installation on mobile Baidu and Haokan . Earnings and target price revision  We t rim 2018 - 20E non - GAAP EPS by 3% - 4% on higher content cost and lower TP to US$270 from US$279 . Price catalyst  12 - month price target: US$ 270.00 based on a Sum of Parts methodology.  Catalyst : mini - program monetisation, AI revenue take - off . Action and recommendation  Reiterate O utpe