/
Equity, Affordability, and Connecting Customers with Assistance Equity, Affordability, and Connecting Customers with Assistance

Equity, Affordability, and Connecting Customers with Assistance - PowerPoint Presentation

elina
elina . @elina
Follow
27 views
Uploaded On 2024-02-02

Equity, Affordability, and Connecting Customers with Assistance - PPT Presentation

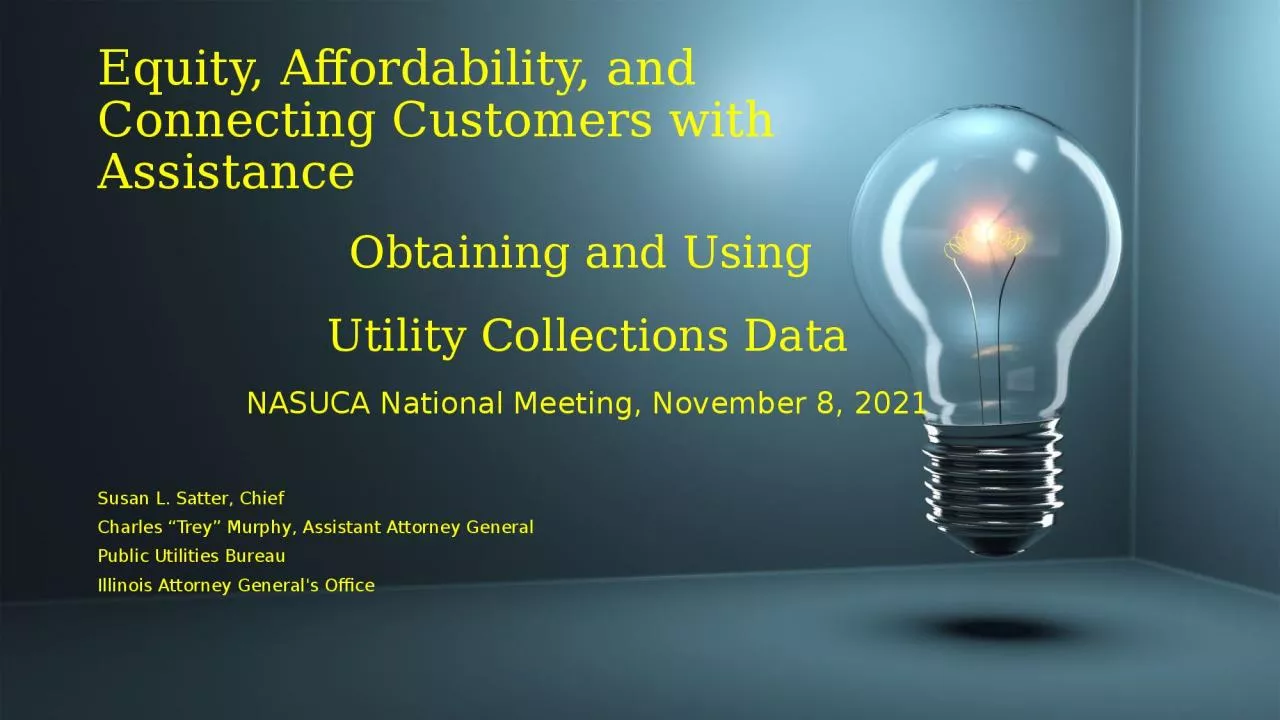
Obtaining and Using Utility Collections Data NASUCA National Meeting November 8 2021 Susan L Satter Chief Charles Trey Murphy Assistant Attorney General Public Utilities Bureau Illinois Attorney Generals Office ID: 1044137

black white zip hispanic white black hispanic zip environmental data income codes justice communities utilities customers illinois performance affordability

Share:

Link:

Embed:

Download Presentation from below link

Download Presentation The PPT/PDF document "Equity, Affordability, and Connecting Cu..." is the property of its rightful owner. Permission is granted to download and print the materials on this web site for personal, non-commercial use only, and to display it on your personal computer provided you do not modify the materials and that you retain all copyright notices contained in the materials. By downloading content from our website, you accept the terms of this agreement.


Presentation Transcript

1. Equity, Affordability, and Connecting Customers with Assistance Obtaining and Using Utility Collections DataNASUCA National Meeting, November 8, 2021Susan L. Satter, ChiefCharles “Trey” Murphy, Assistant Attorney GeneralPublic Utilities BureauIllinois Attorney General's Office

2. Focus on Affordability2009-2010 – General Assembly adopts Percentage of Income Payment Plan and approves Uncollectible Rider for gas and electric utilitiesPIPP funding = $23,305,404Number of customers on PIPP = 22,226LIHEAP funding = $147,979,298Number of customers receiving LIHEAP = 251,433 (typical year)

3. Uncollectible Expenses as % of Residential Revenues Over TimeAmeren GasAmeren ElectricComEdPeoples Gas20131.22%1.27%2.03%9.28%20141.75%1.13%1.21%6.70%20151.52%1.34%1.30%8.14%20161.01%1.43%1.39%7.64%20171.00%1.23%1.22%7.11%20181.16%1.19%1.26%6.50%20191.04%1.14%1.14%7.54%

4. Continuing Affordability IssuesUncollectibles = disconnection, so we intervened in the uncollectible reconciliations to question whether consumers were given enough of a chance to pay and not be disconnected/uncollectibleWe challenged PG infrastructure plan as increasing rates to unaffordable levels. Late 2019, we presented the Commissioners with the NASUCA/NARUC resolutionLed to interest from several commissioners, and opening of an NOI on affordabilityCOVID hit, we encouraged the Governor’s office to both adopt a utility disconnection moratorium and to adjust credit and collection policies for at least 6 monthsConsumer Utility Stipulation

5. New Tools and ProtectionsJoint Consumer Parties acted together Stipulation required 24 month payment plans, extended multiple timesIncreased assistance from consumers – utilities refused to contributeStaggered disconnection notices/disconnectionsEstablished extensive reporting by zip codeShout out to NCLC for pushing utilities to do what they claimed they couldn’t doNew statute continues monthly zip code reporting- 220 ILCS 5/8-201.10 (b)

6. Sample Summary Report

7. Sample Zip Code Data

8. What can we do with zip code data?Better understand service territoriesTarget communications, assistance, and other affordability initiatives Guide performance metricsPresent data to Illinois Commerce Commission during bi-annual policy sessionsCombine with other work (i.e. Environmental Justice)

9. Clean Energy Jobs Act (CEJA)Public Act 102-0662 (passed Sept. 2021)956-page bill that included nuclear plant bailouts, beneficial electrification, electric vehicles, performance metrics, removed late fees and deposits for low-income customers, and more. Codified 22 datapoints that utilities must report at a zip-code level each monthWhile the utilities have been reporting much of this data throughout the COVID moratorium, they reported their first data under the Act on October 15th (September data)

10. OverallUsed data to find 10 zip codes with the highest number of disconnection notices for each of the four largest utilities in Illinois (Commonwealth Edison, Ameren Illinois, Nicor Gas, and Peoples Gas)To avoid skewed data, we looked at zip codes with at least 500 residential customers in Ameren’s territory, and at least 1,000 customers in other territories7/10 of ComEd’s zip codes overlapped with zip codes in the top 10 for either Nicor or Peoples Gas –resulting in 33 unique zip codes between the four major utilitiesRace and Ethnicity - 29 zip codes were majority Black; 2 were majority Hispanic; and 2 were majority white. In comparison, Illinois is 76.8% white, 17.5% Hispanic, and 14.6% Black, overall.

11. Overall (Continued)Income – All 33 zip codes were below the state median income of $65,886; and 28 were below 80% of the state median incomePoverty – 30 of the 33 zip codes had poverty levels higher than the state poverty level of 11.5%29 of 33 were largely filled with Environmental Justice Communities

12. Commonwealth EdisonZip CodeLocation# Res. Cust.# Notices% NoticesMedian HH IncomePoverty LevelRace & Ethnicity60827Calumet Park/ Riverdale8,9701,07211.95%$23,32927.2%Black (89.8%); Hispanic (5.2%); White (3.0%)60466University Park11,8341,40011.83%$54,1557.9%Black (65.5%); White (25.2%); Hispanic (5.0%)60419Dolton8,50999011.63%$46,65818.0%Black (92.3%); White (3.5%); Two or more (1.9%)60426Harvey12,3541,35610.98%$33,18224.8%Black (68.4%); Hispanic (24.1%); White (3.7%)60478Tinley Park6,00364410.73%$61,9296.2%Black (89.7%); White (3.9%); Hispanic (3.7%)60624Garfield Park14,9101,58410.62%$23,42937.6%Black (90.1%); Hispanic (5.1%); White (3.2%)60411Chicago Heights20,7172,13810.32%$47,76918.3%Black (50.2%); Hispanic (27.6%); White (18.6%)60636W. Englewood11,9521,22410.24%$26,72429.5%Black (87.8%); Hispanic (9.4%); White (1.5%)60644S. Austin17,8841,82310.19%$26,90028.7%Black (88.3%); Hispanic (6.9%); White (3.8%) 60621Englewood12,8281,30010.13%$22,15838.7%Black (94.6%); Hispanic (3.2%); White (1.0%)

13. Ameren IllinoisZip CodeLocation# Res. Cust.# Notices% NoticesMedian HH IncomePoverty LevelRace & Ethnicity62206East St. Louis5,3381,20222.52%$36,19625.0%Black (58.3%); White (35.8%); Asian (2.7%)61605Peoria5,7071,21921.36%$21,27643.2%Black (58.1%); White (30.7%); Hispanic (7.9%)62060Madison1,75935220.01%$30,46128.4%Black (53.3%); White (42.0%); Two or More (2.4%)62207Centreville2,98756418.88%$20,27336.5%Black (94.8%); White (3.2%); American Indian (1.3%)62204East St. Louis2,11637017.49%$22,26435.4%Black (93.5%); Hispanic (3.4%); White (1.7%)61603Peoria6,3861,06116.61%$32,45830.1%Black (41.0%); White (40.6%); Hispanic (10.6%)62205Centreville3,12651316.41%$25,82126.5%Black (94.5%); White (2.8%); Hispanic (2.0%)62087S. Roxana79711614.55%$45,20027.4%White (85.1%); Black (9.9%); Hispanic (2.9%)62201East St. Louis2,16931114.34%$15,40850.4%Black (63.8%); Hispanic (26.2%); White (9.2%)62203Centreville2,59935013.47%$39,21616.0%Black (93.9%); White (4.1%); and Asian (0.9%)

14. Affordability – Performance MetricsAs part of the performance metrics process, the Act requires at least one performance metric, addressing affordability, defined as: Achiev[ing] affordable customer delivery service costs, with particular emphasis on keeping the bills of lower-income households, households in equity investment eligible communities, and house in environmental justice communities within a manageable portion of their income and adopting credit and collection policies that reduce disconnections for those households specifically and for customers overall to ensure equitable disconnections, late fees, or arrearages as a result of utility credit and collection practices, which may include consideration of impact by zip code. 220 ILCS 5/16-108.18(e)(2)(A)Emphasis on lower-income households; equity investment eligible communities; and environmental justice communities is repeated throughout the Act.

15. Environmental Justice CommunitiesEnvironmental Justice is: “the principle… that no segment of the population, regardless of race, national origin, age, or income shall bear disproportionately high or adverse effects of environmental pollution.” 415 ILCS 155. Environmental Justice Communities are: Targeted census blocks groups (average of 40 census blocks), typically consisting of between 600-2,000 people, that are experience disproportionately high levels of environmental pollutionIllinois Power Agency (“IPA”) and Illinois Solar For All (“ISFA”) find these areas using a calculation that multiplies environmental exposure levels by socioeconomic factors (next slide)Also, a self-certification process

16. Environmental Justice Communities

17. Environmental Justice CommunitiesZip Codes w/ Highest Disconnection notices (9/21)

18. Commonwealth Edison1 - 608272 - 60466

19. Commonwealth Edison3 - 604194 - 60426

20. Ameren Illinois1- 622062- 61605

21. Ameren Illinois3 - 620604 - 62207

22. Where do we go from here?We’ve been discussing potential uses for the zip code data and overlap with EJ Communities with other stakeholders, for advice on how to guide affordability initiatives, moving forward.CEJA offers many opportunities to use the data, including performance metrics, additional low-income protections, grid investment and enhancements, and the possibility of discount rates.We welcome input from others and would love to hear whether other states are receiving similar data and how they are using it.

23. Thank you for your attentionSusan L. Satter, ChiefCharles “Trey” Murphy, Assistant Attorney GeneralPublic Utilities BureauIllinois Attorney General's Office100 West Randolph Street, 11th FloorChicago, Illinois 60601Susan.Satter@ilag.govCharles.Murphy@ilag.gov