/
10.3.6.3 Measurement and use of luminescence parameters in analysis
.. 10.3.6.3 Measurement and use of luminescence parameters in analysis
..

10.3.6.3 Measurement and use of luminescence parameters in analysis .. - PDF document

ellena-manuel
ellena-manuel . @ellena-manuel
Follow
497 views
Uploaded On 2015-08-29

10.3.6.3 Measurement and use of luminescence parameters in analysis .. - PPT Presentation

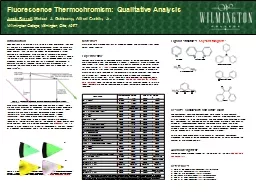
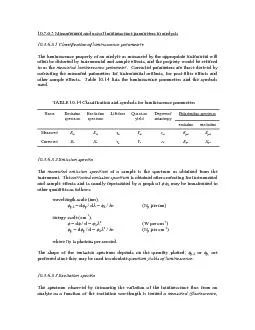
103631 Classification of luminescence parametersThe luminescence property of an analyte as measured by the appropriate instrument will often be distorted by instrumental and sample effects and th ID: 117801

10.3.6.3.1 Classification luminescence parametersThe

Share:

Link:

Embed:

Download Presentation from below link

Download Pdf The PPT/PDF document "10.3.6.3 Measurement and use of luminesc..." is the property of its rightful owner. Permission is granted to download and print the materials on this web site for personal, non-commercial use only, and to display it on your personal computer provided you do not modify the materials and that you retain all copyright notices contained in the materials. By downloading content from our website, you accept the terms of this agreement.


Presentation Transcript

10.3.6.3 Measurement and use of luminescence parameters in analysis 10.3.6.3.1 Classification of luminescence parametersThe luminescence property of an analyte as measured by the appropriate instrument will often be distorted by instrumental and sample effects, and the property would be referred to as the measured luminescence parameter. Corrected parameters are those derived by Measured Corrected measured emission spectrum of a sample is the spectrum as obtained from the corrected emission spectrum is obtained after correcting for instrumental and sample effects and is usually represented by a graph of phosphorescence) excitation spectrum. A corrected excitation spectrum is obtained if the photon flux incident on the sample is held constant. 10.3.6.3.4 Excitation-emission spectraThe three-dimensional spectrum generated by scanning the emission spectrum at incremental steps of excitation wavelength (x axis = emission wavelength, y axis = excitation wavelength, z axis = emission flux) is called a (fluorescence, phosphorescence) excitation-emission spectrum (or ). (Such spectra are commonly represented as contour diagrams or as isometric projections.) synchronously excited (fluorescence, phosphorescence) spectrum obtained by varying both the excitation and emission wavelengths simultaneously is a two-dimensional spectrum which corresponds to the curve where a plane, parallel to the z-axis, intersects 10.3.6.3.5 Lifetime of luminescencelifetime of luminescence is defined as the time required for the luminescence intensity to decay from some initial value to e of that value (e = 2.718 ...). Lifetimes can be measured by phase fluorimetry (phosphorimetry) where the phase shift between the sinusoidally modulated exciting light and the emitted light is measured. fluorimetry (phosphorimetry) is the term used when decay times of luminescence are measured using a pulsed source of radiation. It is often necessary to separate the signal due to the light flash from the luminescence emission signal by a deconvolution technique in order to obtain the correct decay curve for emission. Decay times corrected for this effect are termed corrected decay times of fluorescence or phosphorescence10.3.6.3.6 Quantum yieldsThe quantum yield of luminescence of a species is the ratio of the number of photons emitted to the number of photons absorbed by the sample. The measured quantum yield of luminescence (fluorescence or phosphorescence) is the result of measurement made with a fluorescence (phosphorescence) spectrometer when no corrections are made for instrumental response or for sample effects. The corrected quantum yield of luminescence is obtained when the measured quantum yield is corrected for instrumental response, pre- and post-filter effects and refractive index effects. The energy yield of luminescence of a species is defined as the ratio of the energy emitted as luminescence to the energy absorbed by the species. Quantum yields of fluorescence (phosphorescence) of an analyte are often reduced due to quenching by other species in the analyte solution. Quenching processes generally follow the Stern-Volmer law) -l = where = luminescence yield in the absence of quencher Q = luminescence yield with quencher of concentration = rate constant for quenching = luminescence lifetime in the absence of quencher Q quantum efficiency of luminescence is defined as the fraction of the molecules in a particular excited state which emit luminescence (fluorescence or phosphorescence), in contrast to quantum yield which applies to the system as a whole. 10.3.6.3.7 Linear Polarization of LuminescencePolarization of emission is not of great importance in molecular luminescence spectroscopy unless the solvent used is viscous or solid. The relations between the degree of polarizationdegree of depolarizationdegree of anisotropy, (See Table 10.16) are: / (2 + ) / (1 + 2corrected luminescence excitation polarization spectrum of an analyte is obtained when the polarization is measured as a function of the excitation wavelength which corrected luminescence emission polarization spectrum is the (fluorescence, phosphorescence) spectrum observed when polarization is measured as a function of emission wavelength using a fixed and specified excitation wavelength. In fluorescence analysisblank measure is predominantly due to scattering of the exciting radiation, especially Raman scattering. Fluorescence from the solvent and sample cuvette as well as light scattering in the spectrometer can also be important. In phosphorescence analysis, the blank measure is due to phosphorescent impurities in the solvent and sample cuvette. Other methods of luminescence analysis would include chemiluminescence analysis, where a reaction produces luminescence radiation. A blank measure must also be made for this method. Figure 10.16 illustrates different types of luminescence spectrometer.