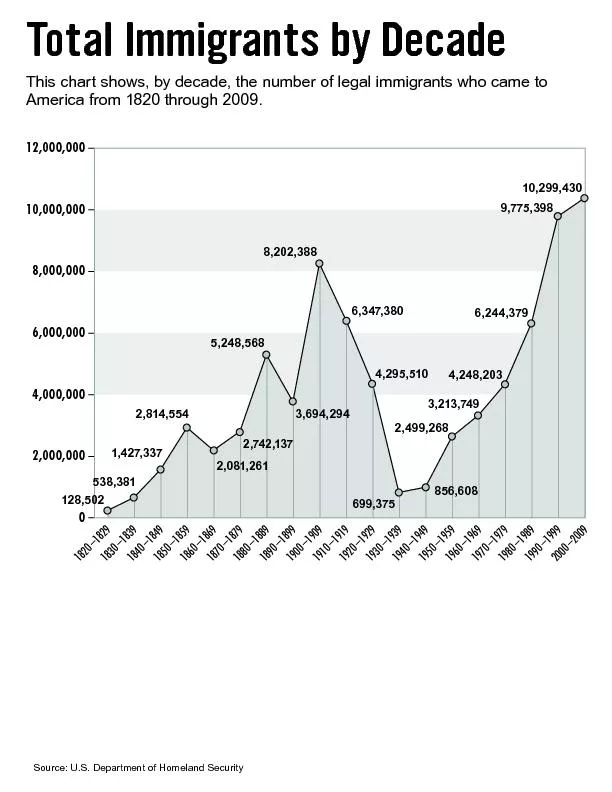
PDF-American Economic Review: Papers & Proceedings 2015, 105(5): 66–7
Author : ellena-manuel | Published Date : 2017-11-28
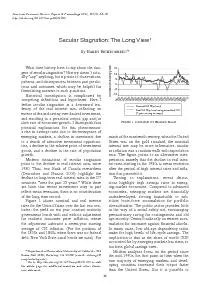
10 5 0 5 10 15Constant maturity yield 1800 1810 1820 1830 1840 1850 1860 1870 1880 1890 1900 1910 1920 1930 1940 1950 1960 1970 1980 1990 2000 2010 Nominal US 10yr
Presentation Embed Code
Download Presentation
Download Presentation The PPT/PDF document "American Economic Review: Papers & Proce..." is the property of its rightful owner. Permission is granted to download and print the materials on this website for personal, non-commercial use only, and to display it on your personal computer provided you do not modify the materials and that you retain all copyright notices contained in the materials. By downloading content from our website, you accept the terms of this agreement.
American Economic Review: Papers & Proceedings 2015, 105(5): 66–7: Transcript
Download Rules Of Document
"American Economic Review: Papers & Proceedings 2015, 105(5): 66–7"The content belongs to its owner. You may download and print it for personal use, without modification, and keep all copyright notices. By downloading, you agree to these terms.
Related Documents