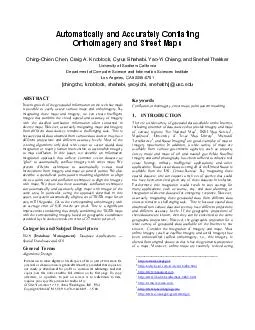
/
Automatically and accurately conflating road vector data street maps and orthoimagery Automatically and accurately conflating road vector data street maps and orthoimagery

Automatically and accurately conflating road vector data street maps and orthoimagery - PDF document

ellena-manuel
ellena-manuel . @ellena-manuel
Follow
395 views
Uploaded On 2017-03-22

Automatically and accurately conflating road vector data street maps and orthoimagery - PPT Presentation

Outline Introduction Motivation Our approach AMSconflation Vector and imagery conflation prequalifying research Map and imagery conflationFinding control points in the imagery and in the mapsGe ID: 330091

Outline Introduction Motivation Our approach: AMS-conflation Vector

Share:

Link:

Embed:

Download Presentation from below link

Download Pdf The PPT/PDF document "Automatically and accurately conflating ..." is the property of its rightful owner. Permission is granted to download and print the materials on this web site for personal, non-commercial use only, and to display it on your personal computer provided you do not modify the materials and that you retain all copyright notices contained in the materials. By downloading content from our website, you accept the terms of this agreement.


Presentation Transcript

Ching-ChienChenPh.D. Dissertation Outline Introduction & Motivation Our approach: AMS-conflation Vector and imagery conflation (pre-qualifying research) Map and imagery conflationFinding control points in the imagery and in the mapsGeospatial point pattern matching (GeoPPM)Image and map conflation using rubber-sheeting Experimental Results Related Work Conclusion and Future Work Lat / LongLat / Long Lat / LongLat / Long Challenges Different projections, accuracy levels, resolutionsresult in spatial inconsistencies Name: Stanley SmithAddress: 125, Gabriel Dr.City: St. LouisState: MOPhone: (314)955-4200Long: -90.4265843 Road Name : Gabriel DrRange: 20 –500 Motivation :Vector and Imagery Integration Lat / LongLat / LongLat / LongLat / Long Different geographic projections and Traditionally, the problems of vector-imagery and map-imagery alignment have been in the domain of GIS and Computer Vision In GIS literature The alignments were previously performed manually ESRI MapMerger; Able R2V; Intergraph I/RASC In Computer Vision literature The alignments were performed automatically based on image processing techniquesOften required significant CPU time Motivation Outline Introduction & Motivation Our approach: AMS-conflation Vector and imagery conflation (pre-qualifying research) Map and imagery conflationFinding control points in the imagery and in the mapsGeospatial point pattern matching (GeoPPM)Image and map conflation using rubber-sheeting Experimental Results Related Work Conclusion and Future Work Resolution (or map scale) 153 m Geo-coordinatesResolutionLong: -90.43Lat: 38.595Long: -90.42Lat: 38.594 42 m 10 m Metadata about the data source Road widths Metadata about the data sourceAMS-Conflation :Exploit Metadata about the Data Source AMS-Conflation :Exploit Peripheral Datasets to the Data Source AMS-Conflation to Align Vector and Imagery Lat / Lon g Lat / Long Control Point Detection Intermediate Filtering control points Triangulation and Rubber-Sheeting -Red lines (roadsides) -Blue lines (centerlines) : the percentage of the reference rwhich we generated conflated lines(Length of matched reference roads)/(Length of reference roads) Correctness (Length of matched conflated lines)/ Positional Accuracy : the percentage of conflated roads within x meters to the reference roadsUsing road-buffermethod x x Reference roadsBuffer zone o f Conflated roads xx x x x Reference roadsBuffer zone o f Conflated roads Results:One of Our Four Test Areas88.49%37.9% •For the other test areas, we align different road vector data (MO-DOT, AMS-Conflation to Ali g n Maps and Ima g er Detect IntersectionPoints On the Map Map with Unknown Coordinates Geo-referenced Imagery Lat/LongLat/Long Points On the Imagery/ Vector Data Conflation Point PatternConflation Finding Intersection Points on Maps Identify Some noisy points will be detected as intersection points. Our geo-spatial point matching algorithm can tolerate the existence of misidentified intersection points. Point Pattern Matching Example: (x,y) = (83,22) Example: (lon,lat) = (-118.407088,33.92993) 80 points400 points Find the mapping between these points Why ? To generate a set of control point pairs How to solve the point sets matching problem : Find the transformation T between the layout (with relative distances) of the two point sets Transformation Check all pairs on S m Points on Map M n Points on Image S T ? Iterate all point pair in M, and for each chosen point pair in Mexamining all point pairs in S Time-consuming : O(mn Can we improve it by randomization ? Not always ! Noisy points on maps Apply T Point Pattern Matching:A Brute-Force Algorithm Exploiting Point Density and Localized Distribution of Points Assumption: we focus on medium to high resolution mapsWe are conflating maps with high resolution imagery ! Level 1: 1.2 m/pixelLevel 2: 4.25 m/pixelLevel 3: 14.08 m/pixelLevel 4: 35 m/pixel Geospatial Point Pattern Matching (GeoPPM):For Map with Unknown Map Scale 4080055 points1059 pointsGeospatial Point Pattern Matching (GeoPPM):Exploit Point Density ( 1 cell ) ( 4 cells ) Level 3 ( 16 cells ( 64 cells e Experimental Setup:Test Data Sets5 maps for each map service:ESRI ,MapQuest, Yahoo, TIGER , USGS topographic maps5 maps for each map service:ESRI ,MapQuest, Yahoo, TIGER (total road length is about 364.28km)(total road length is about 84.32km)MO-DOT Results The performance ofGeoPPM Definition: rel : The relevant point pattern (and there are xmatched points) Patternrel ret : The retrieved point pattern by GeoPPM(and there are Patternret Let set C = Patternrel Precision z / y ; Recall = z / x Recall= 93.75% One 10 matched points in the retrieved pattern Map pointsIma p The performance ofGeoPPM Xeon 1.8GHz with 1GMB memory Test on a Yahoo map with 57 16 seconds 171 seconds5 hours 58 minutes402 imagery pointsUsing HiGrid and road directionsUsing road directions Using map scale and road directions scale only 57 map points 402 57 map points59117 seconds1049 seconds 26 seconds 317 secondsN/A591 imagery points11 seconds503 seconds 16 seconds 171 seconds5 hours 58 minutes402 imagery pointsUsing HiGrid and road directionsUsing road directions Using map scale and road directions scale only 57 map points38 seconds5298 seconds 70 seconds 934 secondsN/A1059 imagery points26 seconds2449 seconds 42 seconds 540 secondsN/A800 imagery points17 seconds1049 seconds 26 seconds 317 secondsN/A591 imagery points11 seconds503 seconds 16 seconds 171 seconds5 hours 58 minutes402 imagery pointsUsing HiGrid and road directionsUsing road directions Using map scale and road directions scale only 100020003000400050004025918001059Number of points in the imageryRunning time (secs) Using map scale only Using map scale and road directions Using road directions only Using HiGrid and road directions The running time ofGeoPPM CompletenessCorrectness 20305070 Original TIGER map Conflated TIGER map Completeness/CorrectnessPositional AccuracyEvaluation:The performance of overall map-imagery conflation Related Work Vector to vector conflation based on corresponding features identified from both vector datasets (in GIS domain) [Walteret al. 99]: Matching featur [Cobbet al. 98]: Matching features Vector to imagery conflation Utilizing matched polygons [Hildet al. 98] Utilizing matched lines [Filinet al. 00] Utilizing matched junction-points [Flavieet al. 00] cted features not forextracting features Related Work Raster to raster conflation: To the best of our knowledge, there is no research addressing the problem of automatic conflation of maps and imagery Related work of imagery-imagery conflation ection process was used to determine a set of features that can be used to conflate two image data setszTheir work requires that the coordinates of both image data setsbe known Dare et al. [Dare 00] proposed multiple feature extraction and matching techniquesNeed to manually select some initial control points Seedahmedet al. [Seedahmed02] proposed an imagery byMoravecfeature detector and obtain transformation parameters by Commercial products: Able R2V and Intergraph I/RASCNeed to manually select all control points Conclusion Our contributions : AMS-Conflation Automatic Vector to Imagery Conflation Vector to Black-White Imagery Alignment [sstd’03]Vector to Color (High-resolution) Imagery Alignment [stdbm’04] [GeoInformatica’05 ? ] Automatic Map to Imagery Conflation [ng2i’03a][acm-gis’04] [Transactions in GIS ?] Building Finder: A System to Automatically Annotate Buildings inSatellite Imagery