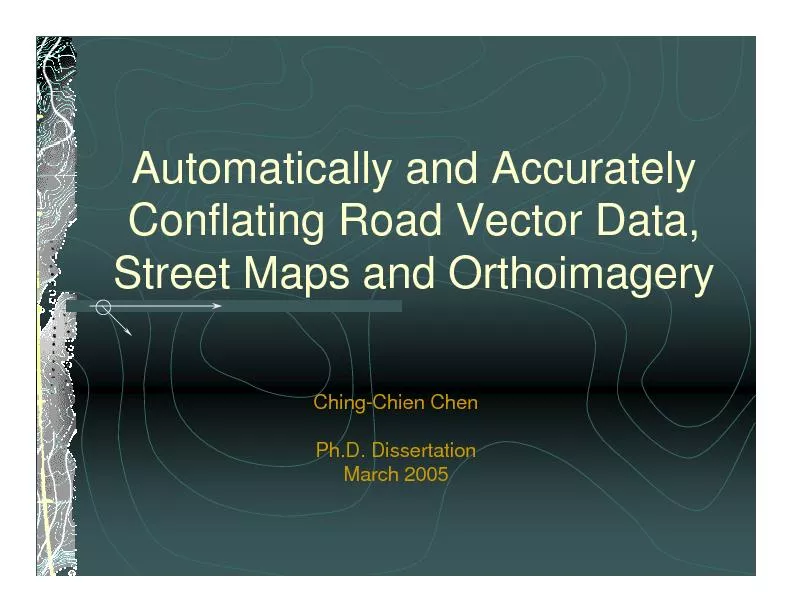
/
Automatically and Accurately Conflating  Orthoimagery and Street Maps Automatically and Accurately Conflating  Orthoimagery and Street Maps

Automatically and Accurately Conflating Orthoimagery and Street Maps - PDF document

myesha-ticknor
myesha-ticknor . @myesha-ticknor
Follow
408 views
Uploaded On 2016-05-22

Automatically and Accurately Conflating Orthoimagery and Street Maps - PPT Presentation

httparcwebesricomscviewerindexhtml httpwwwmapquestcom httpwwwlibutexasedumapsindexhtml httpterraserverusacom httpwwwspaceimagingcom httpwwwcensusgovgeowwwt ID: 330093

http://arcweb.esri.com/sc/viewer/index.html http://www.mapquest.com http://www.lib.utexas.edu/maps/index.html http://terraserver-usa.com/ http://www.spaceimaging.com/ http://www.census.gov/geo/www/t

Share:

Link:

Embed:

Download Presentation from below link

Download Pdf The PPT/PDF document "Automatically and Accurately Conflating ..." is the property of its rightful owner. Permission is granted to download and print the materials on this web site for personal, non-commercial use only, and to display it on your personal computer provided you do not modify the materials and that you retain all copyright notices contained in the materials. By downloading content from our website, you accept the terms of this agreement.


Presentation Transcript

Automatically and Accurately Conflating Orthoimagery and Street Maps Ching-Chien Chen, Craig A. Knoblock, Cyrus Shahabi, Yao-Yi Chiang, and Snehal Thakkar University of Southern California Department of Computer Science and Information Sciences Institute Los Angeles, CA 90089-0781 [chingchc, knoblock, shahabi, yaoyichi, snehalth] @usc.edu ABSTRACTRecent growth of the geospatial information on the web has made it possible to easily access various maps and orthoimagery. By integrating these maps and imagery, we can create intelligent images that combine the visual appeal and accuracy of imagery with the detailed attribution information often contained in http://arcweb.esri.com/sc/viewer/index.html http://www.mapquest.com http://www.lib.utexas.edu/maps/index.html http://terraserver-usa.com/ http://www.spaceimaging.com/ http://www.census.gov/geo/www/tiger/ satellite imagery or aerial photographs these days. However, these maps might align to imagery of a particular resolution and misalign to imagery that has different resolutions or different orthorectification parameters. The fact that many of the online map sources do not provide the geo-coordinates of the maps makes the integration even more complicated. In previous work, we developed an approach to automatically conflating road vectordata with imagery [7]. In this paper we describe how we address the even more challenging problem of automatically conflating street maps (i.e., maps showing roads) with imagery. Figure shows an example of integrating a street map (geo-referenced US Census TIGER map with the scale :4269 which is queried from the TIGER Map Server) and an image (geo-referenced USGS DOQ images with 2-meter per pixel resolution which is queried from Microsoft TerraService). The map is made semi-transparent with the underlying image. We can see that there are certain geospatial inconsistencies between the map and imagery. In this paper, we describe our approach to automatically and accurately aligning orthoimagery with the various online street maps to alleviate these inconsistencies. In addition, we can take maps that have not been geo-referenced and automatically determine the geo-coordinates. By properly aligning imagery with maps, we can annotate objects on imagery, such as roads, streets and parks, with the maps. Consider the example shown in Figure 2. The user sees the imagery of unknown area nearby and notices a park in the imagery. However, the imagery does not provide street names, so the user cannot determine how to reach the park. Using the techniques described in this paper, user can easily obtain an integrated view of the imagery with the map of the area, which would guide the user on how to reach the park. The traditional approach to aligning these various geospatial products is to use a technique called conflation [2], which requires identifying an appropriate set of counterpart features (termed control points) on the two data sources to be integrated. Other points will be moved according to the correspondence between the control point pairs. Various GIS researchers and computer vision researchers have shown that the intersection points on the road networks provide an accurate set of control point pairs [7, 4]. In addition, road networks are commonly illustrated on diverse maps. The identification of these control points is often performed manually, which is a tedious and a) TIGER street map b) Satellite image c) Imagery with superimposed map ( the roads on imagery are represented as white lines) Figure 1: The map-imagery integration without alignment a) Orthoimagery with the area of interest highlighted b) ESRI street map (whose geo-coordinates are unknown) c) Imagery with aligned map Figure 2: The map-imagery integration with alignment _ http://tiger.census.gov/cgi-bin/mapsurfer time-consuming process that is made even harder by the fact that many of the online sources do not even provide the coordinates of the corner points of the maps. We have developed an approach to automatically identify a set of control point pairs by combining different sources of information from each of the sources to be integrated. In particular, we utilize common vector datasets as “glue” to integrate imagery with maps. We first identify feature points on imagery by utilizing some information inferred from vector dataset, and then we detect the same sort of feature points on maps. Finally, we compute the alignment between the two point sets. Now that we have a set of control point pairs for the map and imagery, we can use the conflation technique described in [2] to align the map with the imagery. Our proposed approach facilitates the close integration of vector datasets, imagery and maps, thus allowing the creation of intelligent images that combine the visual appeal and accuracy of imagery with the detailed attribution information often contained in diverse maps. The remainder of this paper is organized as follows. Section 2 reviews our previous work on automatically detecting road intersection points in imagery. Section 3 illustrates the techniques to automatically find road intersection points in street maps. Section 4 presents a specialized point pattern matching algorithm for finding the mapping between the layout (with relative distances) of the intersection points on the imagery and themaps, respectively, to generate a set of control point pairs. Section 5 describes the idea of conflating maps with imagery based on the detected control point pairs. Section 6 provides experimental results. Section 7 discusses the related work and Section 8 concludes the paper by discussing our future plans. 2. PREVIOUS WORK: IDENTIFYING INTERSECTIONS ON IMAGERY Automatic extraction of road intersection points from imagery as feature points is a difficult task due to the complexity that characterizes natural scenes []. In order to efficiently and accurately detect road intersection points on imagery, we utilize existing road network vector databases as part of the prior knowledge. In general, integrating existing vector data as part of the spatial object recognition scheme is an effective approach. The vector data represents the existing prior knowledge about the data, thus reducing the uncertainty in identifying the spatial objects, such as road segments, in imagery. In [6, 7], we described several techniques for automatic conflation of road vector data with imagery. The most effective technique we found exploits a combination of the knowledge of the road network with image processing in a technique that we call localized image processing. With this approach, we first find road intersection points from the road vector dataset. For each intersection point, we then perform image processing in a localized area around the intersection point to find the corresponding point in the image. The running time for this approach is dramatically lower than traditional image processing techniques due to performing image processing on localized areas. Furthermore, exploiting the road direction and width information improves both the accuracy and efficiency of detecting edges in the image. An issue that arises is that the localized image processing may still identify incorrect intersection points, which introduces noise into the set of control point pairs. To address this issue, we utilized a filtering technique termed Vector-Median Filter [7] to eliminate inaccurate control point pairs. Once the system has identified an accurate set of control point pairs, we utilize rubber-sheeting techniques described in [2] to align the vector data with the imagery. With our test sets as described in [7], this approach produced an accurate alignment of the vector data with the imagery. More details about our previous work on vector-imagery conflation is provided in [7]. As a result the conflated intersection points on the road network can be aligned with the intersection points on the imagery. We can then use the conflated intersection points as intersection points on the imagery. Figure 3 shows an example illustrating the detected intersection points on an image, before and after conflating the image with a road network. 3. IDENTIFYING INTERSECTION POINTS ON STREET MAPS Since there are few online street maps with known geo-coordinates, we cannot apply the same localized image processing, described in Section 2, to find intersection points on maps. This is because we cannot find the corresponding vector data for the map, since the map geo-coordinates are unknown. Hence, for those maps whose geo-coordinates are unknown in advance, we utilize automatic map processing and pattern recognition algorithms described below to identify the intersection points on maps. Ideally, intersection points on street maps could be extracted by simply detecting road lines. However, due to the varying thickness a) Imagery with road network, before conflation b) Detected intersection points on imagery, after conflationFigure 3: Intersection points automatically detected on imagery of lines on diverse maps, accurate extraction of intersection points from maps is difficult [9, 23]. In addition, there is often noisy information, such as symbols and alphanumeric characters on the map, which make it even harder to accurately identify the intersection points. To overcome these problems, we adapted the automatic map processing algorithm described in [9] to skeletonize the maps for extracting intersection points. The basic idea is to detect intersection points only on the map that has been pre-processed by line thinning algorithms and noise-removal procedures. In particular, the process can be divided into the following subtasks: () isolate map data by a threshold, (2) decrease line width by thinning algorithms, such as [3], (3) recognize intersection points by crossing number (CN), the number of lines emanating from an intersection point [3], (4) remove misidentified intersections caused by noisy information (such as symbols and text). The details of the line intersections detection algorithm are discussed in [9]. However, this algorithm assumes that the roads are illustrated as multiple single-lined segments on the maps. Therefore, it is not appropriate for the maps where roads are depicted as double lines. In particular, from our experiments with diverse single line online street maps, this algorithm achieved 65% to 95% precision in identifying road intersections, while it worked poorly (with 20% to 30% precision) for double line street maps. To alleviate this problem, instead of using “crossing number(CN)” (for an intersection, its CN must be greater than two) to detect intersections, we utilize feature-detection functions implemented in OpenCV to detectpromising points, such as corners and distinct points. Then, a verification process is conducted to check whether there is any linear structure around each detected corner point. If so, the detected point will be characterized as an intersection point. We found that our revised approach can achieve 76% precision (on average) on our tested street maps. Figure 4 shows an example illustrating the detected intersection points on a map queried from MapQuest. Although our algorithm can significantly reduce the rate of misidentified intersection points on the maps, it is still possible that both noisy points are detected as intersection points and some intersections be missed. For example, the point near the lower right corner (the “E” in “E Grand Ave”) was mistaken for a road. However, our point matching algorithm (described next) can tolerate the existence of misidentified intersection points. 4. POINT PATTERN MATCHING So far we have identified a set of intersections on both the street map and the imagery. Figure 5 shows an example of the two point sets on a map and an image, respectively. The remaining problem is to find the mapping between these points in order to generate a set of control point pairs. The problem of point pattern matching has at its core a geometric point sets matching problem. The basic idea is to find the transformation between the layout (with relative distances) of the intersection point set on the map and the intersection point set on the imagery. The key computation of matching the two sets of points is calculating a proper transformation , which is a 2D rigid motion (rotation and translation) with scaling. Because the majority of map and imageryare oriented such that north is up, we only compute the a) MapQuest map b) Detected intersection points Figure 4: Intersection points detected on a map _ http://sourceforge.net/projects/opencvlibrary a) A map with some detected intersections b) An image (with detected intersections) covers left map Figure 5: Intersection points detected on a map and an image translation transformation with scaling. Without loss of generality, we consider how to compute the transformation where we map from a fraction of the points on maps to the points on imagery. The reason why only a fraction of the points on the maps is considered is that there are misidentified points arising from the processes of image recognition (i.e., identifying intersection points on maps). Moreover, there may be some missing intersection points on the imagery as well. The transformation brings at least a fraction of the points of (on the map) into a subset of (on the imagery). Symbolically, this implies: and M’ , such that T(M’) , where | M’ | M | and T(M’) denotes the set of points that results from applying to the points of . Or equivalently, for a 2D point () in the point set M’ in the matrix form and are scale factors along and direction, respectively, while and are translation factors along and directions, respectively), such that x, y, 1] * longitude, latitude, 1] , where M’ | M | and the 2D point (longitude, latitude) belongs to the intersection point set on the imagery. With this setting, we do not expect point coordinates to match exactly because of finite-precision computation or small errors in the datasets. Therefore, when checking whether a 2D point belongs to the point set we declare that , if there exists a point in that is within Euclidean distance of for a small fixed positive constant which controls the degree of inaccuracy. The minimum such that there is a match of M’ is called Hausdorff distanceDifferent computations of the minimum Hausdorff distance have been studied in great depth in the computational geometry community [8]. We do not seek to minimize but rather adopt an acceptable threshold for . The threshold is small compared to the inter-point distances in In fact, this sort of problem was categorized as “Nearly Exact” point matching problem in [5]. Given the parameters and to obtain a proper transformation we need to compute the values of the four unknown parameters and . This implies that at least four different equations are required. A straight forward (brute-force) method is first choosing a point pair (x) and (x) from M, Then, for every pair of distinct points (lon, lat) and (lon, lat) in , the transformation that map the point pair on to the point pair on is computed by solving the following four equations: + = lon + = lat + = lon2 + = latEach transformation thus generated is applied to the entire points in to check whether there are more than | points that can be aligned with some points on within the threshold . The above-mentioned process is repeated for each possible point pair from , which implies that it could require examining O(|pairs in the worst case. Since for each such pair, we spend O(||) time searching for a match, this method has a worst case running time of O(||). The advantage of this approach is that we can find a mapping (if the mapping exists) with a proper threshold even in the presence of very noisy data. However, it suffers from high computation time. One way to improve the efficiency of the algorithm is to utilize randomization in choosing the pair of points from as proposed in [7], thus achieving the running time of O(||). However, their approach is not appropriate for our datasets because the extracted intersection points from maps could include a number of misidentified intersection points. Assuming that map-scales are provided, we improve the (brute-force) point matching algorithm by exploiting information on direction and relative distances available from the vector sets and maps. The information on direction and distance is used as prior knowledge to prune the search space of the possible mapping between the two datasets. More precisely, given a point pair (x) and (x) on M, we need to only consider pairs (lon, latand (lon, lat) in , such that the ground distance between (xand (x) is close to the ground distance between (lon, lat) and (lon, lat). The ground distance between (x) and (xcalculated by multiplying their Euclidean distance by map scaleFurthermore, the orientations of (x) and (x) should also be close to the orientations of (lon, lat) and (lon, lat). This enhanced algorithm runs in O(|.3 |). We can further improve the performance by transforming the point patterns on maps and imagery to a 2D Euclidean space, where the distance measurement is ground distance. The real world distance is used between points in the transformed space. Therefore, we only consider translation transformation without scaling in such space. In particular, the process (as shown in Figure 6) can be divided into the following subtasks: () Consider the points on the maps: choose one point as origin (0,0), then determine the coordinates of other points ) as follows. is the ground distance between and in east-west orientation, while is the ground distance between and in north-south orientation. Note is negative, if is west to is negative, if is south to . (2) Repeat the similar transformation to the points on imagery. (3) Compare the two point patterns from these two transformed spaces: we now only consider the translation transformation between the two transformed point patterns. The revised algorithm runs in O(||) and works well in our experiments (see Section 6) even in the presence of very noisy data. 5. IMAGE AND MAP CONFLATION Now that we have a set of control point pairs for the map and imagery, we can deform one of the datasets (the source image) to align the other (the target image) utilizing these identified control point pairs. Without loss of the generality, we assume that the map is the source image, while the orthoimage is the target image. To achieve overall alignment of an image and a map, the system must locally adjust the map to conform to the image. It is reasonable to align the two datasets based on local adjustments, because small changes in one area should not affect geometry at long distance. To accomplish local adjustments, the system partitions the domain space into small pieces. Then, we apply local adjustments on each single piece. Triangulation is an effective strategy to partition the domain space to define local adjustments. There are different triangulations for the control points. One particular triangulation, the Delaunay triangulation, is especially suited for the conflation purpose [2]. A Delaunay triangulation is a triangulation of the point set with the property that no point falls in the interior of the circumcircle of any triangle (the circle passing through the three triangle vertices). The Delaunay triangulation maximizes the minimum angle of all the angles in the triangulation, thus avoiding triangles with extremely small angles. We perform the Delaunay triangulation with the set of control points on the map, and make a set of equivalent triangles with corresponding control points on the imagery. The details of the triangulation algorithms can be found in [4, 6]. Imagine stretching a map as if it was made of rubber. We deform the map algorithmically, forcing registration of control points on the map with their corresponding points on the imagery. This technique is called “Rubber sheeting” [25]. There are two steps for rubber sheeting. First, the transformation coefficients to map each Delaunay triangle on the map onto its corresponding triangle on the imagery are calculated. Second, for each pixel in each triangle on the imagery, we replace it semi-transparently with the corresponding pixel on the map by using the computed transformation coefficients. Figure 7 shows an example of Delaunay triangulation, and the arrow illustrates that the pixels of the triangle on the imagery would be (semi-transparently) overlaid by the corresponding pixels on the map (i.e., rubber-sheeting). In practice, if the conflation area (i.e., the convex hull formed by control points ) of the source image is much larger than that of the target image, the rubber-sheeting results will be distorted because the sampling frequency is insufficient. We solve this problem by rescaling the conflation area on the map and imagery to identical sizes before applying triangulation and rubber-sheeting. Figure 8 shows the overall approach for conflating imagery and maps as described in Sections 2 through 5. First, we automatically conflate the road vector data with the orthoimagery to find the intersections in the image. Next, we find the road intersection points on the street map. Then, we utilize a specialized point pattern matching algorithm to align the two point sets and conflation techniques to align the imagery with maps. 6. EXPERIMENTS We utilized a set of online street maps and imagery to evaluate our approach. The purpose of the integration experiment was to evaluate the utility of our algorithms in integrating real world data. We are interested in measuring the accuracy of the integration of maps and imagery using our techniques. To that end, we performed several experiments to validate the hypothesis that using our techniques we can automatically and accurately align maps and imagery. NorthEast West NorthSouthEast West Transform points to another space based on resolutionTransform points to another space based on map-scales Point Pattern Matchingbased on translation Point Pattern on Imagery Point Pattern on Map NorthEast West NorthSouthEast West Transform points to another space based on resolutionTransform points to another space based on map-scales Point Pattern Matchingbased on translation Point Pattern on Imagery Point Pattern on MapFigure 6: Enhanced point pattern matching process Figure 7: Delaunay triangulation on imagery and a map, using identified intersections as control points 6.1 Experimental Setup Table summarizes the datasets and test sites used for our experiments. For each type of map, the threshold , a fixed constant used in point pattern matching routine, was determined by trying a few values and examining the results. We plan to determine the threshold by an iterative process in the future, which will dynamically change the threshold and try to find an acceptable threshold that can carry most of points on one dataset to the points on the other dataset. The experiment platform is Pentium III 700MHz processor with 256MB memory on Windows 2000 Professional (with .NET framework installed). We conducted the experiments as follows. We first obtained online orthoimages covering the experimental area and identified road intersection points on the image by utilizing some information inferred from vector dataset (as described in Section 2 and the performance evaluation was illustrated in [7]). Then, we randomly downloaded various street maps (with diverse sizes and map-scales) within this area from the Internet and extracted an intersection point set for each map. Finally, we computed the alignments between the point set on each map with the point set on the image and acquired the results as described in the following sub-section. 6.2 Experimental Result We identified 28 intersection points on the image of test data set (El Segundo, CA) and 240 intersections on the image of test data set 2 (St. Louis, MO). Because the tested maps are in diverse sizes and scales, the number of points detected on each map is different. On average, there are about 60 points on each map and we achieved 76% precision (on average) for identifying road intersections on different maps. Since the running time of our techniques is mainly dominated by the point matching routine, we used the running time of the point matching routine as the overall execution time (the query time for retrieving online images or maps was not included). In addition, the running time of the point matching algorithm mainly depends on the number of road intersections on the maps, not on the maps sizes or map scales. Map with Unknown Coordinates Detect IntersectionPoints On the Map Lat/LongLat/Long Points On the Imagery/ Vector Data Vector-ImageryConflation Point PatternMatching& Map-ImageryConflation Vector data Geo-referenced Imagery Map with Unknown Coordinates Detect IntersectionPoints On the Map Lat/LongLat/Long Points On the Imagery/ Vector Data Vector-ImageryConflation Point PatternMatching& Map-ImageryConflation Vector data Geo-referenced Imagery Figure 8: Overall approach to align orthoimagery and street maps Table 1: Tested datasets used in experiment Test data set 1 ( El Segundo, CA) Test data set 2 (St. Louis, MO) Imagery Geo-referenced USGS DOQ ortho-images with multiple resolutions Geo-referenced USGS high resolution color ortho-images with 0.3m/pixel resolution Maps (with various sizes/scales) 5 MapQuest maps, 5 TIGER maps, 5 ESRI maps 7 ESRI maps, 6 MapQuest maps, 5 Yahoo mapsTIGER maps, 4 Missouri census geographic base maps Vector data U.S. Census TIGER/Lines NAVTEQ NAVSTREETS Area covered Latitude:33.9Longitude:-Width: 5.2km; Height: .6km Latitude: 38.5808 to 38.595Longitude: -90.4222 to -90.3883 Width: 3km; Height: 2km _ http://maps.yahoo.com/ http://mcdc-maps.missouri.edu/ (population density maps with streets) http://www.census.gov/geo/www/tiger/ http://www.navteq.com/ We found that the average execution time for conflating a map with 60 detected intersection points (possibly with some misidentified points) using our geospatial point matching routine is about two minutes. For each category of maps, the percentage of the tested maps whose point pattern aligned with the corresponding point pattern on the imagery is shown in Table 2. On average, 87.% of our tested maps accurately aligned their intersection point set with the corresponding point pattern on the image. 2.9% of the maps mis-aligned with the image. We noticed that this is because the roads on some of these mis-aligned maps are in grid shape with similar block distances and some maps cover a smaller area compared with other maps. For example, the maps available on MapQuest are in fixed dimensions. The covered area becomes smaller whenever one zooms in the area of his interest. Hence, there is no unique pattern in the points of such large-scale, small maps. We can achieve higher accuracy by focusing on larger maps where there is more likely to be a unique pattern of points. We generated an accurate control point pair set for each map. Then, we used these control points to conflate the maps with imagery. To demonstrate the accuracy of our conflation techniques, some results are shown in Figure 9 to 2. As shown in these aligned images, we can annotate spatial objects (e.g., streets) on imagery with the attribution information contained in maps. In addition, we also conducted a quantitative analysis to our conflation results. Towards that end, we randomly selected a set of TIGER maps and imagery from both our test data sets. These selected maps and imagery cover 4% of our tested area in El Segundo, CA and 50% of our tested area in St. Louis, MO, respectively. Furthermore, after applying our point pattern matching routine against the tested TIGER maps and imagery, we accurately obtained aligned control point sets. The reason why we chose TIGER maps is that the geographic coordinates are provided by the data source. Therefore, we can simply combine the TIGER maps with the corresponding imagery based on geographic coordinates provided. The integration results were then compared with the conflation results by utilizing our approach. Our evaluation used all the road intersections in the maps and measured the displacement of the road intersections to the corresponding road intersections in the imagery. The mean of the point displacements are used to evaluate the accuracy of the algorithms. The experimental results are listed in Table 3 and the displacement distributions of the intersections on maps are shown Table 2: Percentage of the tested maps whose point pattern aligns with the corresponding point pattern on the imagery Test data set 1 (El Segundo, CA) Test data set 2 (St. Louis, MO) MapQuest map TIGER map map MapQuest map TIGER map map Yahoo map MO census geographic base map Percentage 93.3% 86.7% 80% 83.3% 80% 7.4% 00% 00% Figure 9: MapQuest map to imagery conflation (semi-transparent map) for El Segundo, CAFigure 10: TIGER map to imagery conflation ( semi-transparent image) for El Segundo, CA Figure 11: ESRI map to high resolution imagery conflation ( semi-transparent map) for St. Louis, MO Figure 12: MapQuest map to high resolution imagery conflation ( semi-transparent map) for St. Louis, MO in Figure 3. The X-axis of this Figure depicts the displacement between intersection on the maps and the equivalent intersection on the image. The displacement values are grouped every 5 meters. The Y-axis shows the percentage of intersections that are within the displacement range represented by the X-axis. For example, as shown in Figure 3(a), when utilizing our imagery-map conflation approach to the first test data set, 84% of the road intersections on our conflated maps have less than 5 meters displacement from the corresponding imagery points. When simply combining original TIGER-maps with imagery, we obtained .3% points within 5 meters displacement. Furthermore, original TIGER-maps have about 93% points with more than meters displacement, while our conflated maps only have 2.8% points with larger than 0 meters displacement. In sum, as shown in Table 3, for the first test data set, we aligned the TIGER-maps with an average error of 8.35 meters, which is three times better than the original TIGER-maps. For the second data set, we improved the error 2.2 times over the original TIGER-maps on high resolution imagery. 7. RELATED WORK Geospatial data fusion has been one of central issues in GIS[24]. Geospatial data fusion requires that the various datasets be integrated (without any spatial inconsistencies), resulting in a single composite dataset from the integrated elements. Towards automatic geospatial data fusion, a vital step is automated geospatial data conflation to align multiple geospatial datasets. There have been a number of efforts to automatically accomplish vector to vector conflation [9, 2, 26] and vector to imagery (or map) conflation [2, 5]. Our work significantly differs from the previous work in terms of our approach to conflate vector data with imagery. These differences are described in detail in [7]. Furthermore, there has been relatively little work on automatically conflating maps with imagery. In [22], the authors describe how an edge detection process can be used to determine a set of features that can be used to conflate two image data sets. However, their work requires that the coordinates of both image data sets be known in advance. Our work does not assume that coordinates for the maps are known in advance, although we do assume that we know the general region. Dare and Dowman [0] proposed a feature-based registration technique to integrate two images. However, their approach requires users to manually select some initial control points. Some commercial GIS products, such as Able R2V and Intergraph I/RASC provide the functionality of conflating imagery and maps (i.e., raster to raster registration) using different types of transformation methods. However, these products do not provide automatic conflation, so users need to manually pick control points for conflation. Our automatic map to imagery conflation approach utilizes a specialized point pattern matching algorithm to find the corresponding control point pairs on both datasets. The geometric point set matching in two or higher dimensions is a well-studied family of problems with application to different areas such as computer vision, biology, and astronomy [8, 7]. Furthermore, the space partition and deformation techniques (e.g., triangulation and rubber-sheeting) are also used for image warping [3, 20]. 8. CONCLUSION AND FUTURE WORK Given the huge amount of geospatial data now available, our ultimate goal is to be able to automatically integrate this data using the limited information available about each of the data sources. The main contribution of this paper is the design and implementation of a novel data fusion approach to automatically conflate street maps with orthoimagery. We use common vector data as “glue” to integrate imagery with maps. In particular, our approach utilizes the road intersections automatically identified on imagery and maps (whose geo-coordinates are unknown in Table 3: Comparison of the integration accuracy of conflated maps with the original maps Dataset Original TIGER-maps Our conflated maps Mean point displacement (meters) for test data set 1 Mean point displacement (meters) for test data set 2 0 ~ 55 ~1010~1515~2020~25Displacement from the imagery (meters)Percentage of points within displacement Original TIGER-maps Our conflated maps a) Intersection displacement for test data set ~ 5Displacement from the imagery (meters)Percentage of points within displacement Original TIGER-maps Our conflated maps b) Intersection displacement for test data set 2 Figure 13: The displacement distributions of road intersections _ http://www.ablesw.com/r2v/ 5. http://imgs.intergraph.com/irasc/ advance), and applies a specialized point matching algorithm to compute the alignment between the two point sets. Experimental results on the city of El Segundo, CA and the county of St. Louis, MO demonstrate that our approach leads to remarkably accurate alignments of maps and imagery. The aligned map and imagery can then be used to make inferences that could not have been made from either the map or the imagery individually. We intend to extend our approach in several ways. First, we plan to further improve our geospatial point pattern matching, since we have noticed that there is a natural similarity between point pattern matching and string pattern matching, which is the problem of finding a match between a given pattern string and a test string. The main issue is how to efficiently convert the 2D geospatial points to D points without the impact of noisy points (e.g., using Hilbert curve [8]). We also plan to enhance our intersection detection techniques used on maps. We intend to use OCR-related techniques to extract textual information from the maps in order to reduce the impact of these alphanumeric characters. In addition, these pre-extracted textual information (e.g., road names) can be used to label the detected intersections. Therefore, we can even further prune the search space of possible point pattern matchings by using these labeled intersections. An interesting direction with respect to integrating maps is to be able to take arbitrary maps with unknown geo-coordinates and determine their location anywhere within a city, state, country, or even the world. We already have road vector data covering most of the world, so the real challenge is developing a hierarchical approach to the point matching to make such a search tractable. 9. ACKNOWLEDGEMENT This research has been funded in part by NSF grants EEC-52 (IMSC ERC), IIS-0238560 (CAREER), and IIS-0324955, in part by the Air Force Office of Scientific Research under grant numbers F49620-0-0053 and FA9550-04-in part by a gift from the Microsoft Corporation., and in part by a grant from the US Geological Survey (USGS). 10. REFERENCES RENCES 1] Aculair-Fortier, M.-F., Ziou, D., Armenakis, C., and Wang, S. of Work on Road Extraction in Aerial and Satellite Images, Technical Report, Universite de Sherbrooke, 2000.[2] Agouris, P., Stefanidis, A., and Gyftakis, S. Differential Snakes for Change Detection in Road SegmentsPhotogrammetric Engineering & Remote Sensing2): p. [3] Arcelli, C. and Sanniti di Baja, G. A width-independent fast thinning algorithmIEEE Transaction on Pattern Analysis and Machine Intelligence: p. 463-474, [4] Berg, M.d., Kreveld, M.v., Overmars, M., and Schwarzkopf, O. Computational Geometry: Algorithms and Applications, Springer-Verlag, [5] Cardoze, D.E. and Schulman, L.J. Pattern Matching for Spatial Point Sets, In Proceedings of the IEEE Symposium on Foundations of Computer Science[6] Chen, C.-C., Shahabi, C., and Knoblock, C.A. Utilizing Road Network Data for Automatic Identification of Road Intersections from High Resolution Color Orthoimagery, In Proceedings of the Second Workshop on Spatio-Temporal Database Management(STDBM'04), colocated with VLDB, Toronto, Canada, 2004.[7] Chen, C.-C., Thakkar, S., Knoblok, C.A., and Shahabi, C. Automatically Annotating and Integrating Spatial Datasets, In Proceedings of the International Symposium on Spatial and Temporal Databases, Santorini Island, Greece, 2003.[8] Chew, L.P., Goodrich, M.T., Huttenlocher, D.P., Kedem, K., Kleinberg, J.M., and Kravets, D. Geometric pattern matching under Euclidean motion, In Proceedings of the Fifth Canadian Conference on Computational Geometry[9] Cobb, M., Chung, M.J., Miller, V., Foley, H.I., Petry, F.E., and Shaw, K.B. A Rule-Based Approach for the Conflation of Attributed Vector DataGeoInformatica): p. 7-35, 35, 10] DARE, P. and DOWMAN, I. A new approach to automatic feature based registration of SAR and SPOT imagesInternational Archives of Photogrammetry and Remote Sensing, 33(B2): p. p. 11] Filin, S. and Doytsher, Y. A Linear Conflation Approach for the Integration of Photogrammetric Information and GIS DataInternational archives of photogrammetry and remote sensing, 33: p. 282-288, 2000.288, 2000.12] Flavie, M., Fortier, A., Ziou, D., Armenakis, C., and Wang, S. Automated Updating of Road Information from Aerial Images, In Proceedings of American Society Photogrammetry and Remote Sensing Conferenceence13] Goshtasby, A. Piecewise Linear Mapping Functions for Image RegistrationPattern Recognition9(6): p., p., 14] Habib, A., Uebbing, R., Asmamaw, A. Automatic Extraction of Road Intersections from Raster Maps, Technical Report, The Center for Mapping, The Ohio State University., 15] Hild, H. and Fritsch, D. Integration of vector data and satellite imagery for geocodingInternational Archives of Photogrammetry and Remote Sensing, 32(Part 4): p. 246-252516] Hwang, J.-R., Oh, J.-H., and Li, K.-J. Query Transformation Method by Delaunay Triangulation for Multi-Source Distributed Spatial Database Systems, In Proceedings of the 9th ACM Symposium on Advances in Geographic Information Systems, Atlanta, GA, 200017] Irani, S. and Raghavan, P. Combinatorial and experimental results for randomized point matching algorithmsComputational Geometry-2): p. 7-3318] Mokbel, M.F., Aref, W.G., and Kamel, I. Performance of Multi-Dimensional Space-filling Curves, In Symposium on Advances in Geographic Information SystemsMcLean, VA, 2002., 2002.19] Musavi, M.T., Shirvaikar, M.V., Ramanathan, E., and Nekovei, A.R. A Vision Based Method to Automate Map ProcessingPattern Recognition(4): p. 39-326, [20] Ruprecht, D. and Muller, H. Deformed Cross-Dissolves for Image Interpolation in Scientific Visualization,he Journal of Visualization and Computer Animation:ation:1] Saalfeld, A. Conflation: Automated Map Compilation, Ph.D. Dissertation, Computer Vision Laboratory, Center for Automation Research, University of Maryland, [22] Sato, T., Sadahiro, Y., and Okabe, A. A Computational Procedure for Making Seamless Map Sheets, Center for Spatial Information Sciences, University of Tokyo, 200[23] Sebok, T.J., Roemer, L.E., and Malindzak, J., G.S. An Algorithm for Line Intersection Identification,attern Recognition,3(2): p. [24] Usery, E.L., Finn, M.P., and Starbuck, M. Data Integration of Layers and Features for The National Map, In Proceedings of American Congress on Surveying and Mapping, Phoenix, AZ, 2003. [25] White, M.S. and Griffin, P. Piecewise Linear Rubber-Sheet Map Transformation,he American Cartographer,2(2): p.[26] Yuan, S. and Tao, C. Development of Conflation Components., In Proceedings of Geoinformatics, Ann Arbor, Michigan, USA,