/
February 2, February 2,

February 2, - PowerPoint Presentation

ellena-manuel
ellena-manuel . @ellena-manuel
Follow
371 views
Uploaded On 2016-12-17

February 2, - PPT Presentation

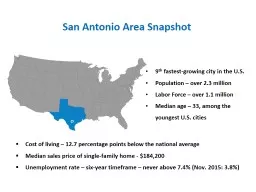
2016 Global Business Travel Association San Antonio Presented by Mario Hernandez President SAEDF 9 th fastestgrowing city in the US Population over 23 million Labor Force over ID: 502606

san antonio amp 2015 antonio san 2015 amp city labor 000 change business force population cities workforce bureau land

Share:

Link:

Embed:

Download Presentation from below link

Download Presentation The PPT/PDF document "February 2," is the property of its rightful owner. Permission is granted to download and print the materials on this web site for personal, non-commercial use only, and to display it on your personal computer provided you do not modify the materials and that you retain all copyright notices contained in the materials. By downloading content from our website, you accept the terms of this agreement.


Presentation Transcript

Slide1

February 2, 2016

Global

Business Travel

Association, San Antonio

Presented by: Mario Hernandez, President, SAEDFSlide2

9

th

fastest-growing city in the U.S.Population – over

2.3 million

Labor Force – over

1.1 millionMedian age – 33, among the youngest U.S. cities

Cost of living – 12.7 percentage points below the national averageMedian sales price of single-family home - $184,200Unemployment rate – six-year timeframe – never above 7.4% (Nov. 2015: 3.8%)

San Antonio Area SnapshotSlide3

Connectivity

Several non-stop and direct flights to New York on multiple airlines.

Direct access to Mexico’s business centers.

Proximity to Dallas and Houston provides easy access to all global destinations.

Crossroads of 3 major interstates and rail lines for fast movement north, south, east, and west.

Central Time Zone allows city to service all of the Americas.Slide4

San Antonio –

Secretly Cool

Vibrant, successful downtown

GeekdomMuseums &

Galleries

Craft Breweries & DistilleriesSymphony Orchestra, Opera, and Tobin CenterBicycle Paths & Bike-Share (13-mile linear park downtown)Nature Trails and K

ayaking ToursSlide5

Solid Economic

Foundation

Strong presence of Biomedical, Aerospace, Cybersecurity, Cloud Computing, Energy, and Defense companies.

Only large U.S. city with Triple-A Bond Rating from all three rating agencies.

City-owned water utility and energy

utility.Geography means low incidence of disruptive weather or natural disasters.Slide6

What others are saying

about San

Antonio

2015 Best Performing Cities: Where America’s jobs are created and sustained –Milken Institute

Top 5

fastest-growing U.S. cites –CNN MoneyTop 5 “secretly cool” city in the U.S. –Huffington Post5th hottest real estate market to watch in 2016 –Trulia

Top 10 for business startups –Business FacilitiesSan Antonio out paces Austin, Houston in Millennial gains –BloombergThe “New Capital of Influence” in the U.S. –ForbesNo. 1 “U.S. Metros with the Most ‘Brain Gain’” –Brookings InstitutionNo. 1 “Best Cities for Young Graduates” –Forbes Slide7

San Antonio Advantages

Workforce of 1,100,000+

Cost of living 12.7 percentage points below the national average

Local government that values growth

Affordable land & energy

Workforce of 1,000,000+15 colleges & universities enrolling 160,000+ studentsSlide8

San Antonio: Population

and Labor Force

Year

Total Population

% Change from Previous Year

Total Civilian Labor Force% Change from Previous Year

20122,194,9272.45%1,001,4162.64%20132,256,7802.82%

1,025,4852.40%20142,289,6911.46%1,056,4033.01%2015 (Nov 2014-Nov 2015)2,336,330

2.04%

1,107,7100.47%

Source: Bureau of Labor

StatisticsSlide9

Employment Growth

: 12 Months Through

November 2015

Source: Bureau of Labor Statistics, Texas Workforce Commission

Place

November

2014November 2015Actual Change 2014-2015

% Change Between 2014-2015San Antonio-New Braunfels1,057,9901,065,9117,9210.75%Austin-Round Rock-San Marcos1,019,1871,028,522

9,335

0.92%Houston-Sugar Land-Baytown

3,147,389

3,090,879

-56,510

-1.80%

Dallas-Fort Worth-Arlington

3,438,689

3,448,535

9,846

0.29%

Texas

12,551,420

12,472,249

-79,171

-0.63%

US

149,056,000

149,308,000

252,000

0.17%Slide10

Unemployment Rate (%)

Place

November 2015

December 2014

December 2013

San Antonio-New Braunfels

3.83.84.9Austin-Round Rock-San Marcos

3.33.44.3Houston-Sugar Land-Baytown4.94.15.1

Dallas-Fort Worth-Arlington

4.04.0

5.2

Texas

4.6

4.6

5.6

US

5.0

5.6

6.7

Source: Bureau of Labor Statistics, Texas Workforce Commission