PPT-FIGURE 4.1.1.1
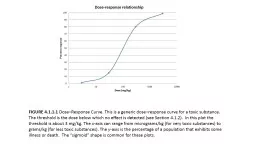
Dose Response Curve This is a generic doseresponse curve for a toxic substance The threshold is the dose below which no effect is detected see Section 412 In this
Download Presentation
"FIGURE 4.1.1.1" is the property of its rightful owner. Permission is granted to download and print materials on this website for personal, non-commercial use only, provided you retain all copyright notices. By downloading content from our website, you accept the terms of this agreement.
Presentation Transcript
Transcript not available.