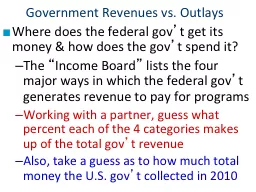
PPT-Government Revenues vs. Outlays
Author : ellena-manuel | Published Date : 2016-05-29
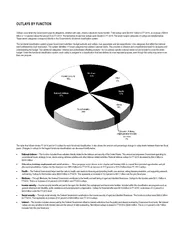
Where does the federal gov t get its money amp how does the gov t spend it The Income Board lists the four major ways in which the federal gov t generates
Presentation Embed Code
Download Presentation
Download Presentation The PPT/PDF document "Government Revenues vs. Outlays" is the property of its rightful owner. Permission is granted to download and print the materials on this website for personal, non-commercial use only, and to display it on your personal computer provided you do not modify the materials and that you retain all copyright notices contained in the materials. By downloading content from our website, you accept the terms of this agreement.
Government Revenues vs. Outlays: Transcript
Download Rules Of Document
"Government Revenues vs. Outlays"The content belongs to its owner. You may download and print it for personal use, without modification, and keep all copyright notices. By downloading, you agree to these terms.
Related Documents