/
High-resolution numerical simulations of lake-effect snowst High-resolution numerical simulations of lake-effect snowst

High-resolution numerical simulations of lake-effect snowst - PowerPoint Presentation

ellena-manuel
ellena-manuel . @ellena-manuel
Follow
393 views
Uploaded On 2017-09-25

High-resolution numerical simulations of lake-effect snowst - PPT Presentation

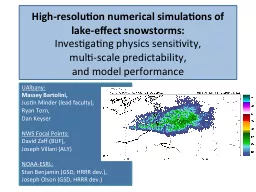
Investigating physics sensitivity multi scale predictability and model performance UAlbany Massey Bartolini Justin Minder lead faculty Ryan Torn Dan Keyser NWS Focal Points David ID: 590507

2013 wrf december lake wrf 2013 lake december lpe precipitation control physics case snow study surface 2016 utc hpa

Share:

Link:

Embed:

Download Presentation from below link

Download Presentation The PPT/PDF document "High-resolution numerical simulations of..." is the property of its rightful owner. Permission is granted to download and print the materials on this web site for personal, non-commercial use only, and to display it on your personal computer provided you do not modify the materials and that you retain all copyright notices contained in the materials. By downloading content from our website, you accept the terms of this agreement.


Presentation Transcript

Slide1

High-resolution numerical simulations of lake-effect snowstorms: Investigating physics sensitivity, multi-scale predictability, and model performance

UAlbany:Massey Bartolini,Justin Minder (lead faculty),Ryan Torn,Dan KeyserNWS Focal Points:David Zaff (BUF),Joseph Villani (ALY)NOAA-ESRL:Stan Benjamin (GSD, HRRR dev.),Joseph Olson (GSD, HRRR dev.)Slide2

Overall Research GoalsSlide3

10-12 December 2013 Case Study (OWLeS IOP2b)Major lake-effect snow event for the typical snow belts downwind of Lake Erie and Lake OntarioSnow accumulations as much as 101.5 cm on the Tug Hill Plateau

500 hPa winds (barbs), vorticity (fill),and heights (contours)Surface / 850 hPa winds (black/blue barbs), surface convergence (contours), and surface–850 hPa temperature difference (fill)Slide4

10-12 December 2013 Case Study (OWLeS IOP2b)Major lake-effect snow event for the typical snow belts downwind of Lake Erie and Lake OntarioSnow accumulations as much as 101.5 cm on the Tug Hill Plateau

500 hPa winds (barbs), vorticity (fill),and heights (contours)Surface / 850 hPa winds (black/blue barbs), surface convergence (contours), and surface–850 hPa temperature difference (fill)Slide5

10-12 December 2013 Case Study (OWLeS IOP2b)Slide6

10-12 December 2013 Case Study (OWLeS IOP2b)KTYX radar-estimated liquid precipitation equivalent (LPE) from 0000 UTC 11 December 2013 to 0000 UTC 12 December 2013, Campbell et al. 2016Slide7

10-12 December 2013 Case Study (OWLeS IOP2b)KTYX radar-estimated liquid precipitation equivalent (LPE) from 0000 UTC 11 December 2013 to 0000 UTC 12 December 2013, Campbell et al. 2016

Time series of automated weighing precipitation gauge LPE measurementsSlide8

WRF Configuration: 10–12 December 2013 Case StudyTriple-nested two-way WRF simulations (12-, 4-, and 1.33-km horizontal grid spacing)Initialized at 1200 UTC 10 December 2013, run for 42 hoursWRF v3.7.1,

experimental HRRR version from Joseph Olson (ESRL)Slide9

WRF Configuration: 10–12 December 2013 Case StudyModel physics: Experimental HRRR (Sept. 2016 version)Initial/boundary conditions: RAP, augmented with NAM soil data and Great Lakes lake-surface temperature and ice cover analysesSlide10

Control Simulation ResultsSlide11

Control Simulation Results:0300 UTC, 11 December 2013Observed ReflectivityWRF Simulated ReflectivitySlide12

Control Simulation Results:1200 UTC, 11 December 2013Observed ReflectivityWRF Simulated ReflectivitySlide13

Control Simulation Results:2000 UTC, 11 December 2013Observed ReflectivityWRF Simulated ReflectivitySlide14

Control Simulation Results:Accumulated Precipitation (snow + graupel)Observed LPE (radar-derived),Campbell et al. 2016

WRF Control LPE (Exp. HRRR)Slide15

Microphysics EnsembleSlide16

Accumulated Precipitation (snow + graupel)Observed LPE (radar-derived),Campbell et al. 2016

WRF Control LPE, MP= Thompson aerosol-aware (THOM AERO)WRF LPE, MP=Morrison (MORR)

WRF LPE, MP=Goddard (GDRD)

WRF LPE, MP=

Milbrandt

-

Yau

(MYAU)

WRF LPE, MP=NSSL 2-momentSlide17

Accumulated Precipitation (snow + graupel)WRF Control LPE, MP=Thompson aerosol-aware (THOM AERO)

WRF LPE, MP= Thompson, no aerosols (THOM ORIG)WRF LPE, MP=WDM6WRF LPE, MP=WSM6

WRF LPE, MP=Stony Brook Univ. – Lin (SBUL)

Observed

LPE (radar-derived),

Campbell et al. 2016Slide18

Precipitation Time SeriesSlide19

Precipitation Time SeriesSlide20

Orographic Enhancement, Downstream Hydrometeor AdvectionMore Tug Hill Precipitation (e.g., WDM6)Less Tug Hill Precipitation (e.g., GDRD)

Lake Ontario

Tug Hill Plateau

Adirondack Mountains

Lake Ontario

Tug Hill Plateau

Adirondack MountainsSlide21

Lake Ontario Snow Band Precipitation StatisticsSlide22

Lake Ontario Snow Band Precipitation StatisticsSlide23

Lake Ontario Snow Band Precipitation StatisticsSlide24

Multi-scale Uncertainty due to Initial/Boundary ConditionsSlide25

Hypotheses for IC/BC SensitivitySlight variations in the position and timing of shortwave trough features, modulating LeS band positionResolution of lake-breeze front location and strength, perhaps a critical mechanism for focusing axis of strongest convection in some LeS cases (e.g., 10-12 Dec. 2013)Land/lake temperature contrast, shoreline resolution

10-12 Dec. 2013 lake-breeze front schematic, Steenburgh and Campbell 2017Slide26

Future WorkSlide27

NCAR Ensemble SimulationsWorking with Craig Schwartz (NCAR) to analyze retroactive NCAR Ensemble simulations for the entire OWLeS field campaign (December 2013 – January 2014)Hope to understand range of synoptic and mesoscale lake-effect snowstorm uncertainty for several case studiesSlide28

Extra SlidesSlide29

WRF Control SimulationNCEI NOMADS server archive is missing soil data (temperature and moisture), so I had to fill these fields from the corresponding NAM filesModified Great Lakes lake-surface temperature (“SKINTEMP”) and fractional ice cover (“SEAICE”) variables in met_em filesUsed Great Lakes Coastal Forecasting System analysis dataset (as in Campbell et al. 2016)

Initial/boundary conditions: RAP, augmented with NAM soil data and Great Lakes lake-surface temperature and ice cover analysesSlide30

Modified Lake Surface TemperaturesSlide31

WRF Control Simulation PhysicsWRF Control: Experimental HRRR, Sept. 2016 versionCopied all namelist.input physics and dynamics settings from Joe Olson’s code repositoryOriginal WRF v3.7.1 MYNN (option 60) performs slightly better than Joe’s MYNN modifications as of Sept. 2016, for this case studyNamelist ParameterOption

mp_physics28 (Thompson aerosol-aware)ra_lw_physics4 (RRTMG)ra_sw_physics4 (RRTMG)sf_sfclay_physics60 (MYNN v3.6)sf_surface_physics3 (RUC LSM)bl_pbl_physics60 (MYNN v3.6)cu_physics1 (Kain-Fritsch, only for 12-km domain)Slide32

Synoptic-scale Uncertainty: 1800 UTC, 11 December 2013RAP: 500 hPa VorticityNARR: 500 hPa VorticitySlide33

Mesoscale Uncertainty,10-12 December 2013 Case StudySteenburgh and Campbell 2017 (MWR, Early Online Release)