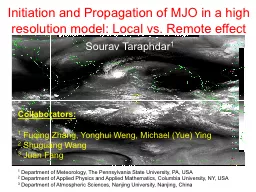
/
Initiation and Propagation of MJO in a high resolution mode Initiation and Propagation of MJO in a high resolution mode

Initiation and Propagation of MJO in a high resolution mode - PowerPoint Presentation

ellena-manuel
ellena-manuel . @ellena-manuel
Follow
388 views
Uploaded On 2017-03-30

Initiation and Propagation of MJO in a high resolution mode - PPT Presentation

vs Remote effect Sourav Taraphdar 1 Collaborators 1 Fuqing Zhang Yonghui Weng Michael Yue Ying 2 Shuguang Wang 3 Juan Fang 1 Department of Meteorology The Pennsylvania State University ID: 531325

mjo cyclone convection tropical cyclone mjo tropical convection sst cyclones atlantic model interactions ocean data 2013 active predictability error

Share:

Link:

Embed:

Download Presentation from below link

Download Presentation The PPT/PDF document "Initiation and Propagation of MJO in a h..." is the property of its rightful owner. Permission is granted to download and print the materials on this web site for personal, non-commercial use only, and to display it on your personal computer provided you do not modify the materials and that you retain all copyright notices contained in the materials. By downloading content from our website, you accept the terms of this agreement.


Presentation Transcript

Slide1

Initiation and Propagation of MJO in a high resolution model: Local

vs. Remote effect

Sourav Taraphdar1

Collaborators

:

1

Fuqing

Zhang,

Yonghui

Weng

, Michael (Yue) Ying

2

Shuguang

Wang

3

Juan

Fang

1

Department of Meteorology, The Pennsylvania State University,

PA, USA

2

Department of Applied Physics and Applied Mathematics, Columbia University,

NY, USA

3

Department of Atmospheric Sciences, Nanjing University, Nanjing, ChinaSlide2

How MJO is initiated over western Indian Ocean (WIO)?

Circumnavigation of a proceeding MJO event that travels around the global tropics (Lau & Peng, 1987; Wang and Li, 1994;

Seo and Kim, 2003; Matthews 2008)

Local tropical forcing's in addition to extratropical forcing's (Ray et al., 2009; Zhao et al., 2013)

A marked increase of

low

level

moisture in association with warmer temperature and anomalous

ascending motion

appeared

5 – 10 days

prior to the convection

initiation

Increase

of moisture was caused primarily by the horizontal advection of the mean specific humidity by anomalous flows induced due to downstream

Rossby

wave response to a preceding suppressed phase MJO over the eastern IOSlide3

Moisture dynamics responsible for the eastward propagation of MJO (Hsu and Li, 2012; Li 2014)

A positive moisture anomaly appears at the PBL (1000 – 700 hPa) to the east of the MJO

convectionMid tropospheric heating associated with MJO convection induces a baroclinic free atmosphere response, with Kelvin (

Rossby

) wave response to the east (west) of convection center

Anomalous low pressure at the top of PBL associated with Kelvin wave response may induce a convergence in the boundary layer, while PBL divergence may occur to the west between two

Rossby

wave gyres

Warm SST anomaly to the east of the convection helps to trigger a fresh convection to the east of the current convection

Hsu and Li, 2012Slide4

What primarily causes MJO initiation ? is it causes by local effects and/or circumnavigating signals (remote effects)?

What are

the role of equatorial Rossby

waves and Kelvin waves

in

preconditioning the

IO for

MJO

propagation using

high resolution model with waves separation techniques?Control Simulation:

WRF model at 9km horizontal resolution following the experimental design of Wang et al., (2015)

Experimental design: Identify the MJO signals into the forcing's data sets

Experiment 1: Removes MJO related signals only from initial condition

Experiment 2: Similar to “1” but removes MJO from boundary conditions

Experiment 3: Removes both from initial and boundary conditions

Events: Oct

2013

during DYNAMO/CINDY

2013

field campaign

ERA-Interim is adopted to construct initial, bottom and lateral boundary conditions for regional simulations

Model simulations start from 1 Oct

2013,

with spectral nudging of horizontal winds for the first 3 daysSlide5

Hovmoller

diagram of daily rainfall from TRMM and WRF clearly shows the MJO event, starting from ~60E and propagating eastwardEastward propagation of precipitation is disrupted near the Maritime Continents (100

o E) in both model and observation

Rainfall associated with MJO is not collocated with the westerly wind maximum but occurs mostly in the leading edge of the westerly regime bordering the easterliesSlide6

Large scale precipitation maxima migrate northward slowly

Precipitation generally coincides with low level cyclonic relative vorticity anomalies during the active MJO phases, might evolve into tropical cyclones in some eventsSlide7

Vertical motion in both the model and observation shows the top heavy first

baroclinic mode structure during active phases of MJO

Changes of westerly to easterly at lower troposphere (600 – 800 hPa) prior to MJO event, and turns back to westerlies during MJO active phases (late Oct to early Nov)

A classical structure of tilted positive temperature anomaly prior to MJO rainfall peak followed by a negative temp anomaly

Dryness of lower troposphere during suppressed phases of MJO, followed by gradual lower level moistening prior to MJO event, when low level wind is easterly and temperature anomaly is positiveSlide8

8

Taraphdar, S

., P.

Mukhopadhyay

, L. R. Leung, F. Zhang, S.

Abhilash

and B.N.

Goswami

. 2014. “

The role of moist processes in the intrinsic predictability of Indian ocean cyclone

”, J.

Geophys

. Res. Atmos., 119,

8032 – 8048, doi:10.1002/2013JD021265

.

Objective

Identify the predictability limit and the mechanism for the error cascades across spatial scales for Indian Ocean tropical cyclones

Approach

Simulate four tropical cyclones in the Bay of Bengal using WRF v3.4 at 30km, 10km and 1.1km horizontal resolutions

Perform identical twin perturbation experiments at the three resolutions to quantify the model errors at each resolution

Estimate the predictability using the

error doubling time

Analyze and elucidate the error cascades across spatial scales using different techniques such as power spectrum and scale separation and using numerical experiments

Impact

Found that buoyancy associated with moist convection plays a major role in intrinsic error growth that limits the intrinsic predictability of tropical cyclonesDemonstrated that errors start to build up from regions of convection and ultimately affects the larger scales through upscale cascades of errors

Error growth starts from the region of convection on Day 1 and cascades to significant larger scale errors on Day 4

The Role of Moist Processes in the Intrinsic Predictability of Indian Ocean Cyclone Slide9

9

Objective

Study how the lingering cold wake from one tropical cyclone may influence the intensity of a later cyclone that passes over the cold wake

Systematically quantify the frequency and impacts of these cyclone-cyclone interactions on mean cyclone intensification rates in the three most active cyclone basins

Approach

Performed data analysis and numerical modeling of two cyclones, Katia and Maria, as a representative case study of cyclone-cyclone interactions in the North Atlantic

Analyzed observational data from 1984–2011 to quantify the frequency of occurrence of cyclone-cyclone interactions and their impacts on basin mean cyclone intensification rates in the North Atlantic, eastern Pacific, and northwestern Pacific

Balaguru K,

S

Taraphdar

,

LR

Leung,

GR

Foltz, and

JA

Knaff

. 2014. “

Cyclone-cyclone Interactions

through the

Ocean Pathway

.”

Geophys

. Res. Lett.,

41, 6855 – 6862. DOI:10.1002/2014GL061489

.

ImpactCyclones have, on average, ∼10% chance to interact with wakes and such interactions reduce the mean intensification rates for cyclones by 3%–6% on average, and by ∼12%–15% during the most active years Identified and quantified “Cyclone-cyclone interactions” as a mechanism through which tropical cyclones may self-regulate their activity to an extent on intraseasonal time scales, with potential implications for future cyclone activities in a warmer climate.Interaction of cyclones Katia and Maria in the North Atlantic (September 2011). The SST cooling (oC) induced by Katia is shown in the background with the tracks of cyclones Katia and Maria overlaid.

Cyclone-Cyclone Interactions through the Ocean Pathway Slide10

10

Linkage of remote SST and Atlantic tropical cyclone activity mediated by the African monsoon

Objective

Systematically

analyze

the relationship between North Atlantic & Mediterranean (NAMED) SST and

Atlantic

Hurricane activity through

their linkages to the

African monsoon rainfall (AMR)

Approach

Analyzed s

everal observational

data for

a 30-years

(1984 - 2013) period

including

NHC TC track data, NOAA OI and UKMO Had SST, ERA and NCEP reanalysis data

set

Establish the dynamical linkages and statistical relationships

Impact

W

armer

NAMED

SST is positively linked to hurricane frequency

east of 45W through its influence on AMRs activity, with more prominent correlation in the latter half of summer (August, September)NAMED SST can explains about 8% on interannual variability of Atlantic TC Frequency

Taraphdar, S.,

LR

. Leung and Samson

Hagos

. 2015

Linkage of remote

Sea surface temperatures

and Atlantic tropical cyclone activity mediated by the African monsoon

”,

Geophys

. Res. Lett

., 42

, 572–578, doi:10.1002/2014GL062600

.

Total

Hurricane

Tropical Storms

A. NOAA OISST

B. NCEP 700hPA Wind

C. NCEP MSE (KJ/Kg)

Composite spatial distribution of A. NOAA OISST (

deg

C), B. 700hPa Wind (m/s), C. Lower level MSE (KJ/Kg) between strong and weak monsoon years. Panel D depicts the distribution of all storms (blue) including hurricanes (brown) and tropical storms (green) under different SST conditions

Strong minus weak monsoon years