PPT-Linear Regression Analysis 5E Montgomery, Peck & Vining
Author : ellena-manuel | Published Date : 2017-04-20
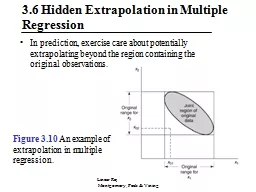
1 36 Hidden Extrapolation in Multiple Regression In prediction exercise care about potentially extrapolating beyond the region containing the original observations
Presentation Embed Code
Download Presentation
Download Presentation The PPT/PDF document "Linear Regression Analysis 5E Montgomery..." is the property of its rightful owner. Permission is granted to download and print the materials on this website for personal, non-commercial use only, and to display it on your personal computer provided you do not modify the materials and that you retain all copyright notices contained in the materials. By downloading content from our website, you accept the terms of this agreement.
Linear Regression Analysis 5E Montgomery, Peck & Vining: Transcript
Download Rules Of Document
"Linear Regression Analysis 5E Montgomery, Peck & Vining"The content belongs to its owner. You may download and print it for personal use, without modification, and keep all copyright notices. By downloading, you agree to these terms.
Related Documents