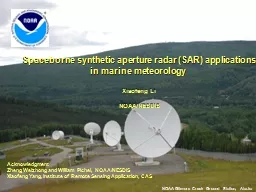
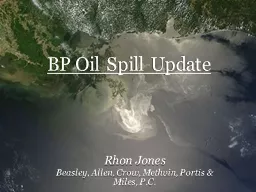
/
SAR detection and model tracking of oil slicks in the Gulf SAR detection and model tracking of oil slicks in the Gulf

SAR detection and model tracking of oil slicks in the Gulf - PowerPoint Presentation

ellena-manuel
ellena-manuel . @ellena-manuel
Follow
405 views
Uploaded On 2016-04-28

SAR detection and model tracking of oil slicks in the Gulf - PPT Presentation

Xiaofeng Li NOAANESDIS XiaofengLinoaagov Contributors William Pichel NOAA 5200 Auth Road Room 102 Camp Springs MD 20746 USA Biao Zhang and Will Perrie Bedford Institute of Oceanography Dartmouth CANADA ID: 296760

sar oil image spill oil sar spill image wind model scattering detection slick slicks surface data gnome bragg case

Share:

Link:

Embed:

Download Presentation from below link

Download Presentation The PPT/PDF document "SAR detection and model tracking of oil ..." is the property of its rightful owner. Permission is granted to download and print the materials on this web site for personal, non-commercial use only, and to display it on your personal computer provided you do not modify the materials and that you retain all copyright notices contained in the materials. By downloading content from our website, you accept the terms of this agreement.


Presentation Transcript

Slide1

SAR detection and model tracking of oil slicks in the Gulf of MexicoXiaofeng Li NOAA/NESDISXiaofeng.Li@noaa.govContributors:William Pichel, NOAA, 5200 Auth Road, Room 102, Camp Springs, MD, 20746, USABiao Zhang and Will Perrie, Bedford Institute of Oceanography, Dartmouth, CANADAOscar Garcia, Florida State University, 117 N. Woodward Avenue, Tallahassee, FL, 32306, USAYongcun Cheng, Danish National Space Center, DTU, DK-2100, Copenhagen, Denmark Peng Liu, George Mason University Slide2

OutlineOil Spill Detection in SAR image Tracking of oil spill movement in the Gulf of MexicoDeepwater Horizon Event – NESDIS Effort to Map Surface Oil with Satellite SARSlide3

Oil detection with image data and complex data:1.1 Oil detection with single-pol SAR image 1.2. A Multi-Pol SAR processing chain to observe oil fields1. Oil Slicks Detection with SARJanuary, 2009Slide4

Mechanism:Oil slick damp the ocean surface capillary waves – making the surface smootherThe smooth surface will reflect the radar pulse in the forward direction -> Less backscatter. Radar image is dark.Challenge:There are a lot of look-alikes in the SAR image, i.e., low wind, coastal upwelling, island shadow, rain cell, biogenic slicks, etc. Solution:Statistical method to extract oil slick from the SAR imageSeparate the look-alikes from the oil slick 1.1 Oil Slicks Detection with single-polSAR imageSlide5

Neural Network Algorithm Canadian Journal of Remote Sensing, Vol 25, No. 5 20091.1 Oil Slicks Detection with single-polSAR image- AlgorithmsSlide6

Neural Network Algorithm demoSlickNo-Slick8bit pixel valueWind MagnitudWind DirectionWind Magnitud (-3 h)Wind Direction (-3 h)Wind Magnitud (-6 h)

Wind Direction (-6 h)

Wind Magnitud (-9 h)

Wind Direction (-9 h)

Beam Mode Incidence Angle

Sea Surface Height

Geostrophic Currents Magnitud

Geostrophic Currents Direction

Neighboor Texture 1 (Brightness)

Neighboor Texture 2 (Contrast)

Neighboor Texture 3 (Distribution)

Neighboor Texture 4 (Entropy)

Neighboor Texture 5 (variability)

Neighboor Texture 6 (Std Deviation)

1st Filter Reaction

2nd Filter Reaction

3rd Filter Reaction

4th Filter Reaction

5th Filter Reaction

6th Filter Reaction

7th Filter Reaction

8th Filter Reaction

9th Filter Reaction

1.1 Oil Slicks Detection with single-polSAR image- AlgorithmsSlide7

1.1 Oil Slicks Detection with single-polSAR image- ResultsSlide8

1.1 Oil Slicks Detection with single-polSAR image- ResultsSlide9

1.1 Oil Slicks Detection with single-polSAR image- Results in GISSlide10
Slide11

TCNNA now has been trained to process SAR data from:-RADARSAT 1-2ENVISATALOSIn this example, Monitoring BP oil spilla SAR image was collected by Envisat on June 9, 2010.Oil is detected close to Louisiana peninsula.Slide12

TCNNA GUI: Display of a a pre-processed output.This Window of the GUI shows wind conditions prevailing on the data from CMOD5 model.A scaled image is rotated and shownto adjust contrast along incidence anglesThe TCNNA Output is exported with itsGeo-referenced tagged information. Ready for Arcmap.Slide13

TCNNA output handled and converted to Shapefile in ArcMap or Kml for Google EarthSlide14

1.1 Single-Pol SAR oil detection summaryStatistical-based SAR oil detection algorithms are developedThese algorithm are tuned for RADARSTA-1, ENVISAT, ALOS, ERS in various beam modeInteractive oil spill analysis software have been developed to aid oil spill analysis at NOAA Slide15

Total power span imageCo-polar correlation coefficientTarget Decomposition entropy (H) mean scattering angle (α) anisotropy AThe combined feature FThe combination of polarimetric features extraction

1.2. A Multi-Polarimetric SAR Processing Chain to Observe

Oil Fields in the Gulf of MexicoSlide16

PolSAR sea surface scatteringSea surface (Rough)Bragg scatteringLow pol.entropyHigh HH VV correlationOil spill (Smooth)Non Bragg scatteringHigh pol. entropyLow HH VV correlationSlide17

Example with: NASA UAVSAR polarimetric L-band SAR, with range resolution of 2 m and a range swath greater than 16 km, June 23, 2010 20:42 (UTC)The image recorded by a video camera confirmed the oil spill.A sub scene of UAVSAR image Slide18

Extracted polarimetric features from the UAVSAR dataSlide19

The combined polarimetric features and the result of OTSU segmentationSlide20

VVHHR2 fine quad-pol SAR image of oil slicks in the GOM acquired at 12:01 UTC May 8, 2010Imaging mode: fine quad-pol SLCAzimuth pixel spacing: 4.95 mRange pixel spacing: 4.73 mNear range incidence: 41.9 degreeFar range incidence: 43.3 degreeNoise floor: ~ -36 dBCase 2: RADARSAT-2 Oil slick observationSlide21

Clean sea surfaceOil slick-covered areaSurface Bragg scatteringNon-Bragg scatteringCapillary and small gravity waves were dampedUnder moderate radar incidence anglesand wind speeds

Case 2: RADARSAT-2 Oil slick observationSlide22

R2 quad-pol observationsscattering matrix entropyalpharepresent and characterize scattering mechanism

Case 2: RADARSAT-2 Oil slick observationSlide23

Entropy represents randomness of scattering mechanismEntropy lowsignificant polarimetric informationEntropy highbackscatter becomes depolarizedSurface Bragg scattering

Non-Bragg scattering

Case 2: RADARSAT-2 Oil slick observationSlide24

Alpha angle characterizes scattering mechanismSurface Bragg scattering dominatesDipole scattering dominates

Even-bounce scattering dominates

Non-Bragg scattering

Bragg scattering

Case 2: RADARSAT-2 Oil slick observationSlide25

For ocean surface Bragg scatteringis smallandhighly correlated

phase difference is close to

For non-Bragg scattering

and

have low correlation

phase difference is close to

CP for quad-polarization:

Case 2: RADARSAT-2 Oil slick observationSlide26

Case 2: RADARSAT-2 Oil slick observationSlide27

Zhang, B., W. Perrie, X. Li, and W. G. Pichel (2011), Mapping sea surface oil slicks using RADARSAT-2 quad-polarizationSAR image, Geophys. Res. Lett., 38, L10602, doi:10.1029/2011GL047013.Case 2: RADARSAT-2 Oil slick observationSlide28

Experimental results demonstrate the physically-based and computer-time efficiency of the two proposed approaches for both oil slicks and man-made metallic targets detection purposes, taking full advantage of full-polarimetric and full-resolution L-band ALOS PALSAR SAR data. Moreover, the proposed approaches are operationally interesting since they can be blended in a simple and very effective processing chain which is able to both detect and distinguish oil slicks and manmade metallic targets in polarimetric SAR data.1.2. A Multi-Polarimetric SAR Processing Chain to ObserveOil Fields in the Gulf of Mexico - SummarySlide29

Introduction to NOAA GNOME Oil drifting modelGNOME SimulationSimulation results – case studyConclusionsMain impacts are: - harm to life, property and commerce- environmental degradation2. Tracking of oil spill movement in the Gulf of MexicoSlide30

Oil Slicks drifting simulation with GNOME model GNOME (General NOAA Operational Modeling Environment) is the oil spill trajectory model used by NOAA’s Office of Response and Restoration (OR&R) Emergency Response Division (ERD) responders during an oil spill. ERD trajectory modelers use GNOME in Diagnostic Mode to set up custom scenarios quickly. NOAA OR&R employs GNOME as a nowcast/forecast model primarily in pollution transport analyses. GNOME can:predict how wind, currents, and other processes might move and spread oil spilled on the water. learn how predicted oil trajectories are affected by inexactness ("uncertainty") in current and wind observations and forecasts. see how spilled oil is predicted to change chemically and physically ("weather") during the time that it remains on the water surface.2. Tracking of oil spill movement in the Gulf of MexicoSlide31

GNOME input:- Location file, specific for each region (tide, bathymetry ,etc.)User file Currents: ocean model outputs Winds: model or buoy wind Oil information: Oil locations from SAR imageSlide32

Model OutputSpill Trajectory TypesBest Guess Trajectory (Black Splots) Spill trajectory that assumes all environmental data and forecasts are correct. This is where we think the oil will go. Minimum Regret Trajectory (Red Splots) Summary of uncertainty in spill trajectories from possible errors in environmental data and forecasts. This is where else the oil could go. Slide33

Case study: Oil pipeline leak in July 2009Slide34

Oil Pipeline leaking in July 2009Slide35
Slide36
Slide37
Slide38
Slide39

Oil pipeline leak in July 2009Surface Currents: Navy Coastal Ocean Model (NCOM) outputs spatial resolution of NCOM is 1/8º temporal resolution is 3 hours Slide40

Oil pipeline leak in July 2009Winds: NDBC hourly wind vectorSlide41

Oil pipeline leak in July 2009Initial Oil distribution information: denoted by blue dots.Model run: 7/26/2009 15:00 UTC 7/29/2009 04:00 UTCSlide42

16:30 UTC on July 27, 2009 Simulation Results:GNOME simulated best guess trajectory of oil spill denoted by blue circles:At the ending of the simulation, 04:00 UTC on July 29, 2009. Slide43

GNOME simulated locations of the oil spill at 04:00 UTC on July 29, 2009: only use wind to force the model; only use the currents to force the model.Simulation Results:GNOME simulated best guess trajectory of oil spill denoted by blue circles:Slide44

In this work, the GNOME model was used to simulate an oil spill accident in the Gulf of Mexico. The ocean current fields from NCOM and wind fields measured from NDBC buoy station were used to force the model. The oil spill observations from ENVISAT ASAR and ALOS SAR images were used to determine the initial oil spill information and verify the simulation results. The comparisons at different time show good agreements between model simulation and SAR observations. Marine Pollution Bulletin, 20102. Tracking of oil spill movement in the Gulf of Mexico - SummarySlide45

Summary:SAR images from multiplatform spaceborne SAR satellite can be used for oil spill/seep detection in the Gulf of Mexico.Statistical-based oil spill detection algorithms have been developed for single-pol SAR image. These algorithms have been tuned for different satellites and different imaging mode.A Multi-Frequency Polarimetric SAR Processing Chain to Observe Oil Fields in the Gulf of Mexico are also developed to provide fast oil spill response at NOAA.The oil spill drifting can be simulated using the NOAA GNOME model with inputs from background current field, time series of wind measurement, and the initial oil spill location.Operational Response Requires: SAR is primary data, visible Sun glint secondary, others tertiary Need multiple looks per day received within 1-2 hours Many sources of data are required Well-trained staff of analysts (10-12) to cover multiple shifts per day Automated mapping would be useful for complicated spill patterns Array of model, in situ, and complementary imagery and products help by providing an oceanographic context.

Wish for the Future

:

What if SAR data were available like this all the time at

no per-image

cost; i.e., just like most other satellite remote

sensing

data?