/
Automating Cerebral Blood Vessel Tortuosity Calculations in MRI Automating Cerebral Blood Vessel Tortuosity Calculations in MRI

Automating Cerebral Blood Vessel Tortuosity Calculations in MRI - PowerPoint Presentation

emery
emery . @emery
Follow
64 views
Uploaded On 2024-01-29

Automating Cerebral Blood Vessel Tortuosity Calculations in MRI - PPT Presentation

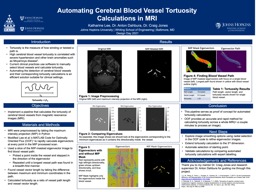
Katharine Lee Dr Anton Dahbura Dr Craig Jones Johns Hopkins University Whiting School of Engineering Baltimore MD Design Day 2021 Tortuosity is the measure of how winding or twisted a path is ID: 1042575

tortuosity vessel mip blood vessel tortuosity blood mip path image length eigenvectors cerebral mri figure calculations masked maximum shows

Share:

Link:

Embed:

Download Presentation from below link

Download Presentation The PPT/PDF document "Automating Cerebral Blood Vessel Tortuos..." is the property of its rightful owner. Permission is granted to download and print the materials on this web site for personal, non-commercial use only, and to display it on your personal computer provided you do not modify the materials and that you retain all copyright notices contained in the materials. By downloading content from our website, you accept the terms of this agreement.


Presentation Transcript

1. Automating Cerebral Blood Vessel Tortuosity Calculations in MRIKatharine Lee, Dr. Anton Dahbura, Dr. Craig JonesJohns Hopkins University | Whiting School of Engineering | Baltimore, MDDesign Day 2021Tortuosity is the measure of how winding or twisted a path is. High cerebral blood vessel tortuosity is correlated with severe hypertension and other brain anomalies such as Moyamoya disease2.Current clinical practices use software to manually select blood vessels and calculate tortuosity.Automating the detection of cerebral blood vessels and their corresponding tortuosity calculations is an efficient solution suitable for clinical settings.Implement a pipeline that calculates the tortuosity of cerebral blood vessels from magnetic resonance images (MRI).ObjectivesIntroductionMaterials and MethodsMRI were preprocessed by taking the maximum intensity projection (MIP) in PythonModified Law et al.’s MATLAB Code for Optimally Oriented Flux (OOF)1 to rapidly calculate eigenvectors at every point in the MIP processed scan.Used a slice of the MIP-masked eigenvector image to find blood vessel path:Picked a point inside the vessel and stepped in the direction of the eigenvectorRepeated until a longest vessel path was found in a breadth-first manner.Found vessel vector length by taking the difference between maximum and minimum coordinates in the path.Calculated tortuosity as a ratio of vessel path length and vessel vector length. ResultsConclusionThis pipeline serves as proof of concept for automated tortuosity calculationsOOF provides an accurate and rapid method for calculating tortuosity across a whole MRI(< a couple minutes to process an image).Figure 1: Image PreprocessingOriginal MRI (left) and maximum intensity projection of the MRI (right).Figure 2—TitleTextFigure 3: Eigenvectors with and without MIP MaskRed represents points with high left/right directionality, green shows up/down directionality, and blue shows in/out.MIP Mask highlights only the eigenvectors inside the blood vessel.Figure 4: Finding Blood Vessel PathImage of MIP masked eigenvectors with focus on a single blood vessel (left). Longest path found shown in yellow with blood vessel outline (right).Acknowledgements and ReferencesThank you to my mentor Dr. Craig Jones and research supervisor Dr. Anton Dahbura for guiding me through this project.Figure 2: Comparing EigenvaluesAs expected, this image shows we should look at the eigenvectors corresponding to the minimum eigenvalues as it contains the directionality inside the vessel.MeasurePath Length72.0 pixelsVector Length57.5 pixelsTortuosity1.25Next StepsExplore image smoothing options using radial selection in the OOF code to refine eigenvector images.Extend tortuosity calculation to the 3rd dimension.Automate selection of starting point.Validate calculations by comparing automated tortuosity calculations with expert labelling.References1.Li, W., Wang, G., Fidon, L., Ourselin, S., Cardoso, M. J., & Vercauteren, T. (2017). On the Compactness, Efficiency, and Representation of 3D Convolutional Networks: Brain Parcellation as a Pretext Task. ArXiv. https://doi.org/10.48550/ARXIV.1707.019922. Telischak, N. A., Yedavalli, V., & Massoud, T. F. (2020). Tortuosity of superior cerebral veins: Comparative magnetic resonance imaging morphometrics in normal subjects and arteriovenous malformation patients. In Clinical Anatomy (Vol. 34, Issue 3, pp. 326–332). Wiley. https://doi.org/10.1002/ca.23589MIP Mask EigenvectorsEigenvector PathTable 1: Tortuosity ResultsPath length, vector length, and tortuosity results shown for single blood vessel.LL0Tortuosity = L/L0Original MRIMIP-Masked MRI