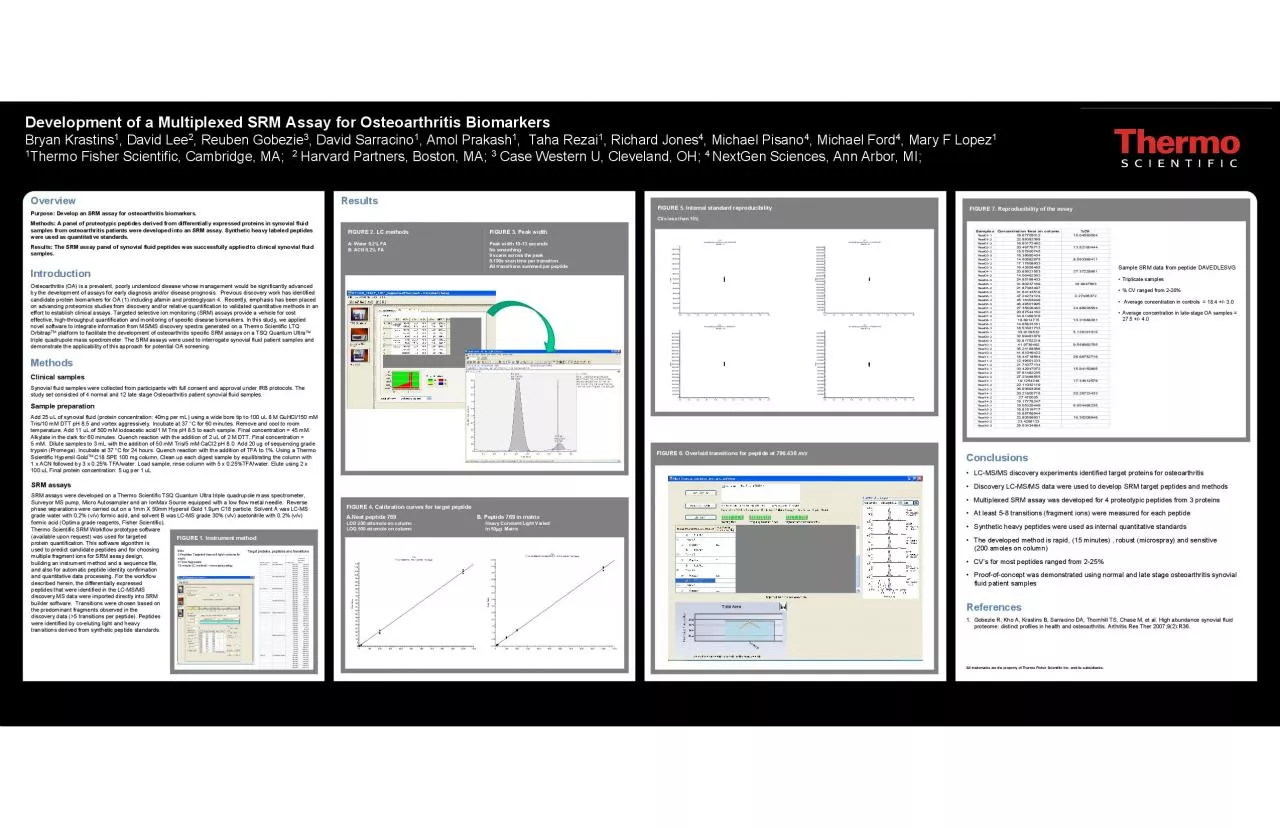
/
OverviewPurpose Develop an SRM assay for osteoarthritis biomarkersMe OverviewPurpose Develop an SRM assay for osteoarthritis biomarkersMe

OverviewPurpose Develop an SRM assay for osteoarthritis biomarkersMe - PDF document

emily
emily . @emily
Follow
342 views
Uploaded On 2022-09-02

OverviewPurpose Develop an SRM assay for osteoarthritis biomarkersMe - PPT Presentation

FIGURE 2 LC methodsA Water 02 FAB ACN 02 FA FIGURE 3 Peak widthPeak width 1013 seconds9 scans across the peak0100s scan time per transitionAll transitions summed per peptide FIGURE 1 Instru ID: 947188

peptides srm fluid peptide srm peptides peptide fluid synovial samples osteoarthritis scientific figure discovery assays 100 transitions column concentration

Share:

Link:

Embed:

Download Presentation from below link

Download Pdf The PPT/PDF document "OverviewPurpose Develop an SRM assay for..." is the property of its rightful owner. Permission is granted to download and print the materials on this web site for personal, non-commercial use only, and to display it on your personal computer provided you do not modify the materials and that you retain all copyright notices contained in the materials. By downloading content from our website, you accept the terms of this agreement.


Presentation Transcript

OverviewPurpose: Develop an SRM assay for osteoarthritis biomarkers.Methods: A panel of proteotypicpeptides derived from differentially expressed proteins in synovial fluid samples from osteoarthritis patients were developed into an SRM assay. Synthetic heavy labeled peptides were used as quantitative standards.Results: The SRM assay panel of synovial fluid peptides was successfully applied to clinical synovial fluid samples.Introduction Osteoarthritis (OA) is a prevalent, poorly understood disease whose management would be significantly advanced by the development of assays for early diagnosis and/or disease prognosis. Previous discovery work has identified candidate protein biomarkers for OA (1) including afaminand proteoglycan4. Recently, emphasis has been placed on advancing proteomics studies from discovery and/or relative quantification to validated quantitative methods in an effort to establish clinical assays. Targeted selective ion monitoring (SRM) assays provide a vehicle for cost effective, high-throughput quantification and monitoring of specific disease biomarkers. In this study, we applied novel software to integrate information from MS/MS discovery spectra generated on a Thermo Scientific LTQ Orbitrapplatform to facilitate the development of osteoarthritis specific SRM assays on a TSQ Quantum Ultratriple quadrupolemass spectrometer. The SRM assays were used to interrogate synovial fluid patient samples demonstrate the applicability of this approach for potential OA screening. Clinical samplesSynovial fluid samples were collected from participants with full consent and approval under IRB protocols. The study set consisted of 4 normal and 12 late stage Osteoarthritispatient synovial fluid samples.Sample preparationAdd 25 uLof synovial fluid (protein concentration: 40mg per mL) using a wide bore tip to 100 uL8 M GuHCl/150 mMTris/10 mMDTT pH 8.5 and vortex aggressively.Incubate at 37 °C for 60 minutes. Remove and cool to room temperature. Add 11 uLof 500 mMiodoaceticacid/1 M TrispH 8.5 to each sample.Final concentration = 45 mM. Alkylatein the dark for 60 minutes.Quench reaction with the addition of 2 uLof 2 M DTT. Final concentration = 5 mM. Dilute samples to 3 mLwith the addition of 50 mMTris/5 mMCaCl2 pH 8.0 Add 20 ugof sequencing grade trypsin(Promega). Incubate at 37 °C for 24 hours. Quench reaction with the addition of TFA to 1%. Using a Thermo Scientific HypersilGoldC18 SPE 100 mg column, Clean up each digest sample by equilibrating the column with 1 x ACN followed by 3 x 0.25% TFA/water. Load sample, rinse column with 5 x 0.25%TFA/water. Elute using 2 x 100 uLFinal protein concentration: 5 ugper 1 uL•LC-MS/MS discovery experiments identified target proteins for osteoarthritis•Discovery LC-MS/MS data were used to develop SRM target peptides and methods•Multiplexed SRM assay was developed for 4 proteotypicpeptides from 3 proteins•At least 5-8 transitions (fragment ions) were measured for each peptide•Synthetic heavy peptides were used as internal quantitative standards•The developed method is rapid, (15 minutes) , robust (microspray) and sensitive (200 amoles on column)•CV’s for most peptides ranged from 2-25%•Proof-of-concept was demonstrated using normal and late stage osteoarthritis synovial fluid patient samplesReferences1.Gobezie R, Kho A, Krastins B, Sarracino DA, Thornhill TS, Chase M, et al. High abundance synovial fluid proteome: distinct profiles in health and osteoarthritis. Arthritis Res Ther2007;9(2):R36.Bryan Krastins, Reuben Gobezie, Amol PrakashThermo Fisher Scientific, Cambridge, MA; Case Western U, Cleveland, OH; NextGenSciences, Ann Arbor, MI; FIGURE 2. LC methodsA: Water 0.2% FAB: ACN 0.2% FA FIGURE 3. Peak widthPeak width 10-13 seconds9 scans across the peak0.100s scan time per transitionAll transitions summed per peptide FIGURE 1. Instrument methodResults FIGURE 4. Calibration curves for target peptideA.Neat peptide 769B. Peptide 769 in matrix LOD 200 attomoleon columnHeavy Constant/Light Varied LOQ 500 attomoleon column in 50g MatrixA.. FIGURE 5. Internal standard reproducibilityCVs less than 15% FIGURE 6. Overlaid transitions for peptide at 796.436 FIGURE 7. Reproducibility of the assayAll trademarks are the property of Thermo Fisher Scientific Inc.and its subsidiaries. SRM assaysSRM assays were developed on a Thermo Scientific TSQ Quantum Ultra triple quadrupolemass spectrometer, Surveyor MS pump, Micro Autosamplerand an IonMaxSource equipped with a low flow metal needle.Reverse phase separations were carried out on a 1mm X 50mm HypersilGold 1.9µm C18 particle. Solvent A was LC-MS grade water with 0.2% (v/v) formic acid, and solvent B was LC-MS grade 30% (v/v) acetonitrilewith 0.2% (v/v) formic acid (Optima grade reagents, Fisher Scientific). Thermo Scientific SRM Workflow prototype software (available upon request) was used for targeted protein quantification. This software algorithm is used to predict candidate peptides and for choosing multiple fragment ions for SRM assay design, building an instrument method and a sequence file, and also for automatic peptide identity confirmation and quantitative data processing. For the workflow described herein, the differentially expressed peptides that were identified in the LC-MS/MS discovery MS data were imported directly into SRM builder software. Transitions were chosen based on the predominant fragments observed in the discovery data (�5 transitions per peptide). Peptides were identified by co-eluting light and heavy transitions derived from synthetic peptide standards. 796Y = 0.104094*X R^2 = 0.9985 W: Equal 0 100 200 300 400 500 600 700 800 900 1000 1100 5 15 20 25 30 35 40 45 50 55 60 65 70 75 80 85 90 95 100 105 110 115Area Ratio 796Y = 0.00688947+0.00582708*X R^2 = 0.9992 W: Equal 0 100 200 300 400 500 600 700 800 900 1000 1100 0.0 0.5 1.0 1.5 2.0 2.5 3.0 3.5 4.0 4.5 5.0 5.5 6.0 6.5Area Ratio 799Average Response Factor = 6.81879e+006 %RSD = 3.7 0.0 0.2 0.4 0.6 0.8 1.0 1.2 1.4 1.6 1.8 2.0 1000000 2000000 3000000 4000000 5000000 6000000 7000000 8000000 9000000 10000000 11000000 12000000 13000000Area 861Average Response Factor = 2.33716e+007 %RSD = 2.0 0.0 0.2 0.4 0.6 0.8 1.0 1.2 1.4 1.6 1.8 2.0 2000000 4000000 6000000 8000000 10000000 12000000 14000000 16000000 18000000 20000000 22000000 24000000 26000000 28000000 30000000 32000000 34000000 36000000 38000000 40000000 42000000 44000000 46000000Area 585Average Response Factor = 1.9879e+007 %RSD = 2.6 0.0 0.2 0.4 0.6 0.8 1.0 1.2 1.4 1.6 1.8 2.0 2000000 4000000 6000000 8000000 10000000 12000000 14000000 16000000 18000000 20000000 22000000 24000000 26000000 28000000 30000000 32000000 34000000 36000000 38000000Area 569Average Response Factor = 9.86078e+006 %RSD = 2.8 0.0 0.2 0.4 0.6 0.8 1.0 1.2 1.4 1.6 1.8 2.0 1000000 2000000 3000000 4000000 5000000 6000000 7000000 8000000 9000000 10000000 11000000 12000000 13000000 14000000 15000000 16000000 17000000 18000000 19000000Area SamplesConcentration fmol on column%CVReal01-119.6770501215.04550004Real01-222.89382395Real01-316.93172492Real02-120.4677971313.52160444Real02-215.57900745Real02-318.39680434Real03-114.505829758.593368411Real03-217.17808903Real03-316.42658485Real04-120.8562155327.37228961Real04-214.06462362Real04-324.85198403Real05-131.8023716919.9947663Real05-221.87383497Real05-331.64143519Real06-147.242741242.27405372Real06-245.16403949Real06-346.49501995Real07-127.3562646224.88928564Real07-220.87544162Real07-334.61469316Real08-118.691471513.21588261Real08-214.65633161Real08-318.53381733Real09-135.91295325.126161015Real09-232.99491879Real09-332.81752218Real10-141.97394929.558992755Real10-235.24188886Real10-341.61049422Real11-118.4471856426.68752716Real11-212.49601233Real11-321.74377134Real12-133.4294707215.94150895Real12-237.61482235Real12-327.23468555Real13-119.125424817.34612579Real13-222.11032119Real13-326.93693266Real14-120.2180071520.26723433Real14-227.470025Real14-319.17778247Real15-119.053294496.604498235Real15-218.81519717Real15-316.85768944Real16-122.8055690116.30208948Real16-223.4298123Real16-329.53434864 Sample SRM data from peptide DAVEDLESVG•Triplicate samples •% CV ranged from 2-26%•Average concentration in controls = 18.4 +/-3.0•Average concentration in late-stage OA samples = 27.5 +/-4.0Target proteins, peptides and transitionsTargetproteinPeptideParentmassFragmenttransitionmassdermicidinENAGEDPGLAR564.724246.156564.724513.314564.724628.081564.724757.383564.724814.294564.724885.442ENAGEDPGLARhea 569.727256.164569.727523.022569.727638.194569.727767.392569.727824.298569.727895.45dermicidinDAVEDLESVGK581.267203.898581.267390.234581.267519.277581.267747.138581.267876.2581.267975.499DAVEDLESVGKhea 585.265211.835585.265398.248585.265527.291585.265755.219585.265884.332585.265983.513proteoglycan4GFGGLTGQIVAALST 796.436244.891796.436272.82796.436319.197796.436404.156796.436406.229796.436661.138796.436760.456796.436787.4796.436873.54796.4361001.598796.4361059.66GFGGLTGQIVAALST 799.94244.632799.94327.211799.94403.72799.94414.243799.94669.402799.94768.126799.94881.211799.941009.613799.941066.459799.941167.773afaminIAPQLSTEELVSLGEK857.459532.996857.459632.361857.459765.202857.459874.487857.4591003.53857.4591104.578857.4591191.718 ESI+3 Peptides Targeted (heavy & light versions for each)4 Time Segments15 minute LC method –microspraysetup