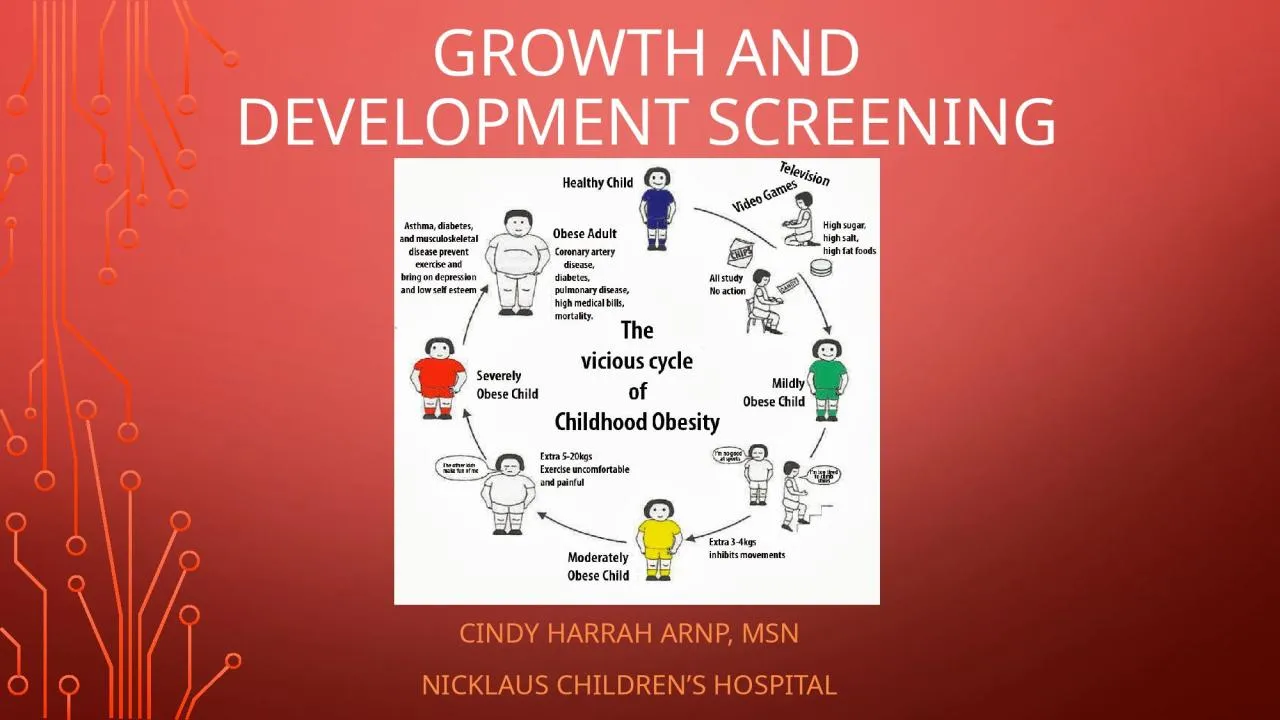
/
Growth and Development Screening Growth and Development Screening

Growth and Development Screening - PowerPoint Presentation

ethlyn
ethlyn . @ethlyn
Follow
342 views
Uploaded On 2022-06-01

Growth and Development Screening - PPT Presentation

Cindy Harrah ARNP MSN Nicklaus Childrens Hospital Bmi screening Mandates FL Statute 38100564a69 Provision of screenings Florida Administrative Code Chapter 64F6003 Grade level mandates for screening ID: 912887

health bmi obese referral bmi health referral obese school obesity intervention children screening risk weight results follow growth cheer

Share:

Link:

Embed:

Download Presentation from below link

Download Presentation The PPT/PDF document "Growth and Development Screening" is the property of its rightful owner. Permission is granted to download and print the materials on this web site for personal, non-commercial use only, and to display it on your personal computer provided you do not modify the materials and that you retain all copyright notices contained in the materials. By downloading content from our website, you accept the terms of this agreement.


Presentation Transcript

Slide1

Growth and Development Screening

Cindy Harrah ARNP, MSNNicklaus Children’s Hospital

Slide2

Bmi screening Mandates

FL Statute 381.0056(4)(a)(6-9)Provision of screeningsFlorida Administrative Code Chapter 64F-6.003

Grade level mandates for screening

Growth and Development

FirstThirdSixthNinthOptional for StateRequired for TCT

Slide3

Procedure for Height and weight

WeightStandard Scale-calibrated for accuracyRemove bulky clothing Subtract 1 pound for remaining clothing

Record to the nearest ½ pound

Height

Remove shoes if possibleSubtract ½ inch if unable to remove shoesWall mount or StadiometerHeels, buttocks, and shoulder blades against surfaceRight angle block to crown of head

Slide4

Bmi calculation

Calculation of BMI and BMI PercentileCHEERCDC School Tools

CDC BMI calculator

Manual

BMI = Weight (kg) ÷ Stature (cm) ÷ Stature (cm) x 10,000 BMI = Weight (lb) ÷ Stature (in) ÷ Stature (in) x 703

Growth Charts

Gender specific

Correlates with body fat

Not a direct measureTrend growth/weight patternsMay indicate potential for health problem

Slide5

Obesity Definition based on BMI

PediatricsObese - BMI> 95% for gender and age

At risk/overweight -

BMI=85-94%

AdultsObese – BMI> 30Overweight – BMI=25-30

Slide6

BMI and Cheer

Enter screening results in CHEERIncluding opt outIndicate referral < 5% automatic referral

> 95% referral

Excludes athletic build

BP requiredPrint appropriate letterNow available in CHEER

Slide7

BMI procedure

BMI Results Interpretation< 5% UnderweightAutomatic referral

5->85% Healthy Weight

85->95% Overweight

At risk for health problemsReferral at RN discression95% ObeseAutomatic referral

Excludes students with athletic build (RN

discrestion

)

Requires Blood PressureBMI results letters generated and sent to parent

Referral

Non-referral

Maintain confidentiality

Nutrition Education materials distributed to student and parent

Slide8

Special Considerations

UnderweightShould be evaluated by RNUnderlying causeDisease process

Neglect

Financial resources

DepressionBody imageProvide education

Slide9

Special Considerations

ObeseConsider muscle mass/athletic buildAt risk for health problemsMonitor Blood PressureRepeat abnormal

Depression

Provide Education

Slide10

Common Effects of Obesity

Type 2 Diabetes is almost entirely attributable to obesity. Obese children are reported to be 12 times more likely to have high fasting blood insulin levels.

Orthopedic complications are due to the fact that bones and cartilage are in the process of development and are not strong enough to bear excess weight.

Hypertension is due to

elevated blood pressure levels that have been found to occur about 9 times more frequently among obese children.Social Difficulties obese children are often stereotyped as “unhealthy, unsuccessful & lazy”.

Students may be teased or verbally abused by other children and can become excluded from being a part of social groups and/or other activities

.

Lower academic achievement/scores

77% of obese children will be obese adults while only 7% of non-obese children will be obese adults

Slide11

Health consequences of obesity

Slide12

CDC 2015 Youth Risk Behavior Surveillance Physical Activity Middle School

Slide13

CDC 2015 Youth Risk Behavior Surveillance Dietary habits Middle

School

Slide14

Percentage of High School Students Who Had Obesity,* 1999-2015

* ≥ 95th percentile for body mass index, based on sex- and age-specific reference data from the 2000 CDC growth charts

Increased 1999-2015 [Based on linear and quadratic trend analyses using logistic regression models controlling for sex, race/ethnicity, and grade (p < 0.05). Significant linear trends (if present) across all available years are described first followed by linear changes in each segment of significant quadratic trends (if present).]

Note: This graph contains weighted results.

National Youth Risk Behavior Surveys, 1999-2015

Slide15

BMI Follow up

Identify all referred students CHEER reportTracking tool3 Follow up attempts requiredLetter first follow up

Track all subsequent contacts

Slide16

BMI Follow Up

Complete versus incomplete referralComplete referralReturned MD Letter ideal

Healthy Lifestyle Intervention

RN level

CHEER documentationEncounterFollow upIncomplete ReferralParent contact establishedRefusal of intervention/PCP care/nutrition consult

PCP appointment not completed

No parent contact

Student withdrawn from school

Slide17

Healthy lifestyle Intervention

Previously- Obesity InterventionCompleted by RN Referred

students

>

95%Intervention (service code 5054)Parental Consent requiredHealth education and counselingIndividual Health Care PlanCompletion of one goal5 servings of fruits/vegetables<

2 hours of screen time

1 hour or more of physical activity

No sweetened beverages

Slide18

Document BMI follow-up in cheer

Open original screeningAdd follow up Complete

Healthy Lifestyle Intervention (

Obesity Intervention)

Returned signed PCP referral letterIncompleteNo parent contactParent contacted only

Slide19

Document in cumulative

Health recordScreening results documented in cumulative health recordHealth Jacket (DOH-3041)

Record dates of screening, referral, and outcome

Record results, referral and outcome in narrative*

Screening form (optional) placed in health jacketResults, referral, and outcome documented on form onlyRecommend stapling to Health Jacket

Slide20

Resources

Center for Disease ControlFlorida School Health Administrative Guidelines (2012-update pending)Manual For School Health FacilitatorsSchool Health Service Plan Miami Dade County