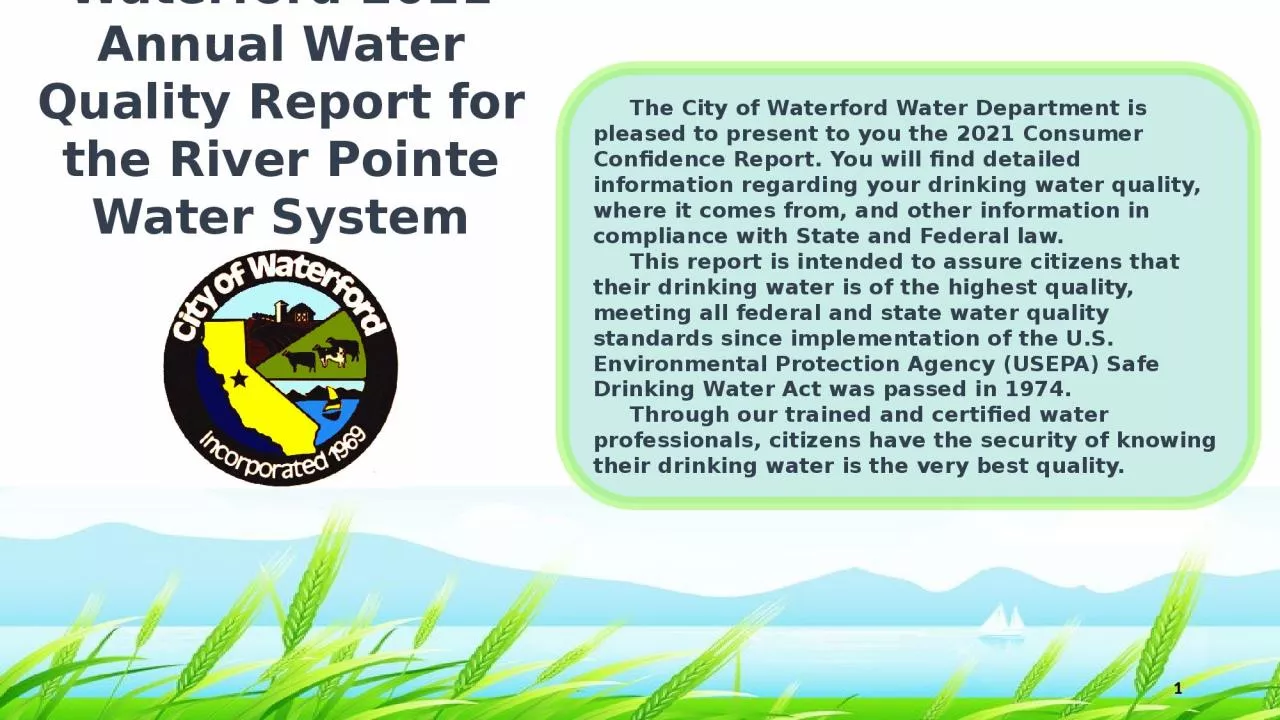
/
Waterford 2021 Annual Water Quality Report for the River Pointe Water System 5010042 Waterford 2021 Annual Water Quality Report for the River Pointe Water System 5010042

Waterford 2021 Annual Water Quality Report for the River Pointe Water System 5010042 - PowerPoint Presentation

evans
evans . @evans
Follow
65 views
Uploaded On 2023-09-25

Waterford 2021 Annual Water Quality Report for the River Pointe Water System 5010042 - PPT Presentation

The City of Waterford Water Department is pleased to present to you the 2021 Consumer Confidence Report You will find detailed information regarding your drinking water quality where it comes from and other information in compliance with State and Federal law ID: 1021210

contaminants water health drinking water contaminants drinking health state information level contaminant source natural detected risk control mcls deposits

Share:

Link:

Embed:

Download Presentation from below link

Download Presentation The PPT/PDF document "Waterford 2021 Annual Water Quality Repo..." is the property of its rightful owner. Permission is granted to download and print the materials on this web site for personal, non-commercial use only, and to display it on your personal computer provided you do not modify the materials and that you retain all copyright notices contained in the materials. By downloading content from our website, you accept the terms of this agreement.


Presentation Transcript

1. Waterford 2021 Annual Water Quality Report for the River Pointe Water System 5010042 The City of Waterford Water Department is pleased to present to you the 2021 Consumer Confidence Report. You will find detailed information regarding your drinking water quality, where it comes from, and other information in compliance with State and Federal law. This report is intended to assure citizens that their drinking water is of the highest quality, meeting all federal and state water quality standards since implementation of the U.S. Environmental Protection Agency (USEPA) Safe Drinking Water Act was passed in 1974. Through our trained and certified water professionals, citizens have the security of knowing their drinking water is the very best quality.1

2. The City of Waterford is pleased to provide you with water that meets the United States Environmental Protection Agency (USEPA) standards for safety. In accordance with the USEPA and California regulations under the Safe Drinking Water Act, water utilities are required to provide detailed water quality information to their consumers. Found in this report is water quality information of the River Pointe Water System. This report contains important information about your drinking water. If the report is not available in your native language, we encourage you to identify someone who understands it and can translate for you.City of Waterford Contact InformationMailing AddressP.O. Box 199Waterford, Ca. 95386(209) 874-2324Este informe contiene información importante sobre su agua potable. Tradúzcalo o hable con alguien que lo entienda bien. Para información en español, llame por favor al (209) 874-2328.Welcome2

3. River Pointe Conservation ProgramConservation goals are still underway. Senate Bill 7 (SB X7-7 of 2009) requires Urban and Agriculture to reduce water use 20% by 2021. The citizens of River Pointe worked together and significantly reduced water usage by 20%. For ways to save visit: http://saveourwater.com/The average U.S. household uses approximately 400 gallons of water per day or 100 gallons per person per day? Luckily, there are many low-cost and no-cost ways to conserve water. Small changes can make a big difference – try one today and soon it will become second nature.Take short showers – a 5 minutes shower uses 4 to 5 gallons of water compared to up to 50 gallons for a bath.Shut off water while brushing your teeth, washing your hair, and shaving and save up to 500 gallons a month.Use a water-efficient showerhead. They are inexpensive, easy to install, and can save you up to 750 gallons a month.Run your clothes washer and dishwasher only when they are full. You can save up to 1,000 gallons a month.Water plants only when necessary.Fix leaking toilets and faucets. Faucet washers are inexpensive and take only a few minutes to replace. To check your toilet for a leak, place a few drops of food coloring in the tank and wait. If it seeps into the toilet bowl without flushing, you have a leak. Fixing it or replacing it with a new, more efficient model can save up to 1,000 gallons a month.Adjust sprinklers so only your lawn is watered. Apply water only as fast as the soil can absorb it and during the cooler parts of the day to reduce evaporation.Teach your kids about water conservation to ensure a future generation that uses water wisely. Make it a family effort to reduce next month’s water bill!Visit www.epa.gov/watersense for more information.3

4. Sampling and TreatmentA Source Water Assessment is available. Please contact The City of Waterford for more information. 4 River Pointe relies solely on groundwater for the drinking water system. As water moves through the hydrological cycle, or water cycle, and through the earth to our aquifer it dissolves naturally-occurring minerals and, in some cases, radioactive material, and can pick up substances resulting from human activity. In order to ensure that tap water is safe to drink, the U.S. Environmental Protection Agency (USEPA) and the State Water Resources Control Board (SWRCB) prescribe regulations that limit the amount of certain contaminants in water provided by public water systems. The U.S. Food and Drug Administration regulations and California law also establish limits for contaminants in bottled water that provide the same protection for public health. Additional information on bottled water is available on the California Department of Public Health website (https://www.cdph.ca.gov/Programs/CEH/DFDCS/Pages/FDBPrograms/FoodSafetyProgram/Water.aspx).

5. The State Water Resources Control Board requires us to inform you that:“Drinking water, including bottled water, mat reasonably be expected to contain at least small amounts of some contaminants. The presence of contaminants does not necessarily indicate that the water poses a health risk. More information about contaminants and potential health effects can be obtained by calling the USEPA’s Safe Drinking Water Hotline (1-800-426-4791). “Some people may be more vulnerable to contaminants in drinking water than the general population. Immuno-compromised persons such as people with cancer undergoing chemotherapy, persons who have undergone organ transplants, people with HIV/AIDS or other immune system disorders, some elderly, and infants can be particularly at risk from infections. These people should seek advice about drinking water from their health care providers. USEPA/Centers for Disease Control (CDC) guidelines on appropriate means to lessen the risk of infection by Cryptosporidium and other microbial contaminants are available from the Safe Drinking Water Hotline (1-800-426-4791).USEPA and the State Water Resources Control Board5

6. Contaminant Information Contaminants that may be in source water include:Microbial contaminants, such as viruses and bacteria that may come from sewage treatment plants, septic systems, agricultural livestock operations, and wildlife. Inorganic contaminants, such as salts and metals, which can be naturally Inorganic contaminants, such as salts and metals, which can be naturally-occurring occurring or result from urban storm water runoff, industrial or domestic wastewater or result from urban storm water runoff, industrial or domestic wastewater discharges, oil and gas production, mining, or farming. Pesticides and herbicides, which may come from a variety of sources such as agriculture, urban storm water runoff, and residential uses. Organic chemical contaminants, including synthetic and volatile organic chemicals, which are by-products of industrial processes and petroleum production, and can also come from gas stations, urban storm water runoff, agricultural application, and septic systems. Radioactive contaminants, that can be naturally be naturally-occurring or be the result of oil and gas production or mining activities. Nitrate in drinking water at levels above 10 mg/L is a health risk for infants of less than six months of age. Such nitrate levels in drinking water can interfere with the capacity of the infant’s blood to carry oxygen, resulting in a serious illness; symptoms include shortness of breath and blueness of the skin. Nitrate levels above 10 mg/L may also affect the ability of the blood to carry oxygen in other individuals, such as pregnant women and those with certain specific enzyme deficiencies. If you are caring for an infant, or you are pregnant, you should ask advice from your health care provider. Nitrate levels may rise quickly for short periods of time because of rainfall or agricultural activity. 1,2,3-trichloropropane or TCP was an impurity in soil fumigants used from the 1950’s to the 1980’s, has been detected in some of the wells used to supply your drinking water. Prior to 2018 TCP was an unregulated contaminant. However, the State Water Resources Control Board adopted a new Maximum Contaminant Level (MCL) of 5 parts per trillion (ppt) for TCP that went into effect on January 1st of 2018. The average TCP level detected in the City water supply during the 2018 calendar year was 0.0 ppt. Some people who drink water containing TCP in excess of the MCL over many years may have an increased risk of getting cancer.6

7. Water Quality Sampling7 On a monthly basis, City staff collect samples for approximately 170 contaminants as required by the State. For more detailed information, we have provided you with a table showing what types of contaminants have been tested, the results of those water samples, and the State MCLs (Maximum Contaminant Levels). The State allows us to monitor for some contaminants less than once per year because the concentrations of these contaminants do not change frequently. Some of our data, though representative, are more than one year old.The table below lists contaminants which: 1) have associated primary Maximum Contaminant Levels (MCLs) that are registered and 2) were detected by the City of Waterford's Water Services Division. Contaminants were detected below, at or above the Detection Limits for Purposes of Reporting (DLR). The presence of these contaminants in the drinking water does not necessarily indicate that the water poses a health risk. More information about contaminants and potential health risks can be obtained by calling the U.S. Environmental Protection Agency (EPA) at (800) 426-4791 or visiting the agency's website at www.epa.gov/safewater.hfacts.html. California action levels are available on the State Water Resources Control Boards website www.waterboards.ca.gov. Table 1 lists all regulated contaminants with Primary MCLs that the City of Modesto's Water Services Division detected in the drinking water below, at or above the State DLR. Table 2 lists regulated contaminants with Secondary MCLs that were detected at or above the State DLR. Table 3 lists disinfection residuals and by-products that were detected in the treated water. DLR: detection limit for reporting mg/L: number of milligrams in one liter of water n/a: not applicable NTU: nephelometric turbidity units pCi/L: picocuries per liter (a measure of radiation) ppb: parts per billion ppm: parts per million ppt: parts per trillion TT: treatment technique µS/cm: micro-siemens/cm >: Greater than <: less than LRAA: locational Running Annual Average The following tables on pages 8 - 11 contain detailed information showing what type of chemicals have been found in the water, the results, and the State Maximum Contaminate Levels (MCLs)

8. 8COMPARATIVE FIGURES FOR INTERPRETINGMEASUREMENTS WITHIN THIS REPORT1 PPM1 PPB1 PPT1 second in 11.5 days1 second in nearly 32 years1 second in nearly 32,000 years1 penny out of $10,0001 penny of $10,000,0001 penny of $10,000,000,0001 inch of 15.8 miles1 inch of 15,782.8 miles1 inch of 657.6 trips around the equator1 minute in 1.9 years1 minute in 19 centurys1 minute in 1,900 millenniums1 ounce in 62,500 pounds1 ounce in 31,250 tons1 ounce in 31,250,000*SOURCE: AMERICAN WATER WORKS ASSOCIATION (AWWA) WEBSITEDEFINITION OF TERMSMaximum Contaminant Level (MCL): The highest level of a contaminant that is allowed in drinking water. Primary MCLs are set as close to the PHGs (or MCLGs): as is economically and technologically feasible. Secondary MCLs are set to protect the odor, taste, and appearance of drinking water. Maximum Contaminant Level Goal (MCLG): The level of a contaminant in drinking water below which there is no known or expected risk to health. MCLGs are set by the U.S. Environmental Protection Agency. Public Health Goal (PHG): The level of a contaminant in drinking water below which there is no known or expected risk to health. PHGs are set by the California Environmental Protection Agency. Primary Drinking Water Standard (PDWS): MCLs and MRDLs for contaminants that affect health along with their monitoring and reporting requirements, and water treatment requirements.Maximum Residual Disinfectant Level (MRDL): The highest level of a disinfectant allowed in drinking water. There is convincing evidence that addition of a disinfectant is necessary for control of microbial contaminants. Maximum Residual Disinfectant Level Goal (MRDLG): The level of a drinking water disinfectant below which there is no known or expected risk to health. MRDLGs do not reflect the benefits of the use of disinfectants to control microbial contaminants. Regulatory Action Level: The concentration of a contaminant which, if exceeded, triggers treatment or other requirements that a water system must follow. Treatment Technique (TT): A required process intended to reduce the level of a contaminant in drinking water. Variances and Exemptions: State Board permission to exceed an MCL or not comply with a treatment technique under certain conditions.

9. 9TABLE 1 - DETECTED REGULATED CONTAMINANTS WITH MCL'SINORGANIC CONTAMINANTSCONTANIMANTUNITSMCLPHGDLRAVGRANGEYEAR SAMPLEDVIOLATION TYPICAL SOURCE OF CONTAMINANTSArsenicCopperNickelSilverPpbug/lug/lug/l105010100.0040.150.0700.0702n/an/an/aND00000002016202120212021NoNoNoNoErosion of natural deposits; runoff from orchards; glass and electronics production wastes BariumSeleniumZincPpmug/lug/l15.05021.10.20.01n/an/a.17900.464.116-.24200-0.464201620212021NoNoNoErosion of natural deposits; discharges of oil drilling wastes and from metal refineriesFluorideppm21.1.5.48-.602016NoErosion of natural deposits; water additive that promotes strong teeth; discharge from fertilizer and aluminum factoriesNitrateppm1010.32.182.182021NoErosion of natural deposits; runoff/leaching from fertilizer use, septic tanks and sewageGross AlphaManganese pCi/Lug/l154.0000014.000.2413.55.047-.4342.4-4.720152021NoNoErosion of natural depositsSYNTHETIC ORGANIC CHEMICALS/HERBICIDES AND PESTICIDES CONTANIMANTUNITSMCLPHGDLRAVGRANGEYEAR SAMPLEDVIOLATIONTYPICAL SOURCE OF CONTAMINANTSDibromo-chloropropane (DBCP)1,2,3 Trichloropropane (TCP)OdorpptPptTON200511.7.7ND1051ND0.00ND0.00-500202020182021NoNoNoBanned nematicide that may still be present in soils due to runoff/leaching from former use on soybeans, cotton, vineyards, tomatoes and tree fruitHistorical application of soil fumigants

10. 10AT THE TAP CONTAMINANTSCONTANIMANTUNITSACTION LEVELPHGDLR# OF SAMPLES90TH% CONCENTRATIONYEAR SAMPLED#SAMPLE > ACTION LIMITSTYPICAL SOURCE OF CONTAMINANTSCopperppm1.3.3.0510ND20200Internal corrosion of household plumbing systems; erosion of natural deposits; leaching from wood preservativesLeadppb15.2510ND20200Internal corrosion of household water plumbing systems; discharges from industrial manufacturers; erosion of natural depositsTABLE 2 - DETECTED REGULATED CONTAMINANTS WITH SECONDARY MCL'SCONTANIMANTUNITSSTANDARDSPHGDLRAVGRANGEYEAR SAMPLEDVIOLATIONTYPICAL SOURCE OF CONTAMINANTSChlorideArsenicPpmug/l5002.0n/an/an/an/a93.5067.9-1190-1020162021NoNoRunoff and leaching from natural deposits; seawater influence Specific ConductanceuS/cm1600n/an/a539.5436-6432016NoSubstances that form ions when in water; seawater influence Total Dissolved Solidsppm1000n/an/a341273-4092016NoRunoff/leaching from natural deposits TurbidityCadmiumNTUug/l50.17n/a1.0n/a1.0.90.5-1.20-.50020162021NoNoSoil runoffIronAluminumAntimonyug/lug/lug/l300504.0n/an/an/a1000.570.576.02.310ND-6.32.310202120212021NoNoNoRunoff and leaching from natural deposits; industrial wasteADDITIONAL INORGANIC CONTAINMINANTSCONTANIMANTUNITSMCLPHGDLRAVGRANGEYEAR SAMPLEDVIOLATIONTYPICAL SOURCE OF CONTAMINANTSHardness(as CaCO3)ppmn/an/an/a96.563-1302018No“Hardness” is the sum of polyvalent cations present in the water, generally magnesium and calcium. The cations are usually naturally occurring.

11. 11BACTERIOLOGIAL CONTAMINANTsCONTANIMANTUNITSMCLPHGDLRAVGRANGEYEAR SAMPLEDVIOLATIONTYPICAL SOURCE OF CONTAMINANTSHeterotrophic Plate Countcfu/mln/an/an/a5ND-102021Non/aBACTERIOLOGIAL CONTAMINANTsCONTANIMANTUNITSMCLPHGDLRHighest MonthYEAR SAMPLEDVIOLATIONTYPICAL SOURCE OF CONTAMINANTSTotal Coliform BacteriaPresent / Absent>5.0% per month0n/a0%2021NoNaturally present in the environment TABLE 3 - DETECTED DISINFECTION BY-PRODUCTS AND DISINFECTION RESIDUALDISINFECTANT RESIDUAL CONTANIMANTUNITSMCLPHGDLRAVGRANGEYEAR SAMPLEDVIOLATIONTYPICAL SOURCE OF CONTAMINANTSChlorinemg/l44n/a1.10.25-1.502021NoDrinking water disinfectant added for treatmentDISINFECTANT BY-PRODUCTSCONTANIMANTUNITSMCLPHGDLRAVERANGEYEAR SAMPLEDVIOLATIONTYPICAL SOURCE OF CONTAMINANTSTotal Haloacetic Acidsppb60n/an/a1.051.0-1.12021NoBy-product of Drinking water disinfectionTrihalomethanes (Total)ppb80n/an/a3.853.7-4.02021NoBy-product of Drinking water disinfection